NHC
An Evaluation of NHC Service Enhancements, Part 2: Post-Tropical Cyclone Advisories
Brad Reinhart, Hurricane Specialist

In Part 1 of this blog series, we discussed the NHC’s usage of Potential Tropical Cyclone advisories to better message the threats posed by tropical cyclones (TCs) that develop near land. Another challenging situation occurs when a tropical cyclone loses its tropical characteristics while it approaches the coastline. For example, Sandy (2012) lost its tropical characteristics and transitioned into a post-tropical cyclone near the time of landfall, which made communicating hazard information difficult. Following that event, the National Weather Service (NWS) adopted a policy to improve service during similar future situations. Under current policy, if the post-tropical cyclone poses a significant threat to life and property, and if the transfer of responsibility to another NWS office1 would result in a discontinuity in service, the NHC will continue to write advisories on the system. This includes the full suite of standard TC products, watches, warnings, and hazard information.
This policy change was driven by a desire to ensure consistent product availability and messaging during high-impact events. Has it worked? Let’s take a closer look at how NHC has leveraged this strategy in recent hurricane seasons.
What Is a Post-Tropical Cyclone?
Post-tropical cyclone is a generic term for a system that was formerly a TC, but no longer possesses sufficient tropical characteristics to be classified as a TC. As a reminder, TCs are warm-core and non-frontal cyclones with organized deep convection and a closed surface wind circulation about a well-defined center. In the Atlantic Ocean, TCs commonly transition to extratropical (ET) cyclones as they recurve into the mid-latitudes. Since an ET cyclone derives its energy from temperature differences between warm and cold air masses and is associated with fronts, its structure is fundamentally different from a TC. So once a weather system transitions to an ET cyclone, it no longer satisfies TC criteria and would be considered “post-tropical”.

A common misconception is that a TC has been “downgraded” when it becomes a post-tropical cyclone. This is certainly not the case. Unlike systems in their developmental stages that tend to be weaker before genesis, many post-tropical cyclones are powerful systems that simply no longer possess tropical characteristics. An analysis of NHC post-tropical cyclone advisory events (below) indicates that over half of these cyclones were producing winds of 58 mph or greater at the time of post-tropical transition. Four of these systems were producing hurricane-force (≥ 74 mph) winds when they became post-tropical cyclones. In addition to strong winds, these systems can produce other hazards that pose a significant threat to life and property on land. Storm surge, destructive waves, and flooding rains are dangerous regardless of whether the system producing these conditions is still a TC or has recently become a post-tropical cyclone. Furthermore, ET cyclones often have a larger wind field than TCs, which increases the footprint of potential wind and surge impacts.

Usage of Post-Tropical Cyclone Advisories

From 2013-2022, the NHC has issued 41 advisories for 13 Atlantic post-tropical cyclones. The figure below shows the length of time that NHC continued to provide forecasts for each storm following its post-tropical transition. While the majority of the post-tropical cyclone advisories lasted for 12 hours or less, a few events continued for longer than 24 hours. In 2016, the NHC issued advisories for an additional three days as Post-Tropical Cyclone Hermine meandered offshore the U.S. Mid-Atlantic coast.

The table below provides a summary of how often different watches and warnings were in effect with post-tropical cyclone advisories. While tropical storm warnings are most commonly in effect, there have been a couple of instances where hurricane and storm surge warnings were maintained with post-tropical cyclone advisories. This strategy is used not only for United States land threats, but international ones as well. Because many Atlantic TCs become ET cyclones as they recurve northward over the western Atlantic Ocean, some post-tropical cyclones bring significant impacts to Atlantic Canada as they pass near or over the region. The Canadian Hurricane Centre (CHC) has issued Tropical Storm and Hurricane Watches and Warnings for tropical and post-tropical cyclones since 2004, so the NHC policy aligns well with our colleagues in Canada. As we will show, this consistency has resulted in more effective hazard communication for post-tropical cyclones that have impacted Canada in recent years.

Case Studies
Hurricane Matthew (2016)

Matthew was a catastrophic storm that made landfall in Haiti as a category 4 hurricane (on the Saffir-Simpson Hurricane Wind Scale), resulting in hundreds of fatalities and widespread damage. After additional major hurricane landfalls in Cuba and the Bahamas, Matthew moved roughly parallel to the coast of the southeastern United States and made a final hurricane landfall in South Carolina. As Matthew moved back offshore and passed near the North Carolina coast, the cyclone began losing tropical characteristics as it interacted with an approaching frontal system and became a 75-mph extratropical cyclone while it was centered about 60 miles east of Cape Hatteras, North Carolina.
Although no longer a hurricane, Matthew was still producing very strong winds to the west of its center, resulting in hurricane-force gusts over coastal portions of eastern North Carolina and a continued storm surge on the sound side of the barrier islands. Due to these continued land impacts, the NHC retained advisories on Post-Tropical Cyclone Matthew and maintained Tropical Storm Warnings and Hurricane Watches for portions of coastal North Carolina, as well as for the Pamlico and Albemarle sounds. (Note: The NWS did not introduce an operational storm surge watch/warning until 2017). The NHC produced a couple of extra advisories until the post-tropical cyclone moved far enough offshore that the wind and surge threat subsided for coastal North Carolina. Ultimately, the highest coastal water levels in the state occurred on the sound side of the Outer Banks, with maximum estimated inundation levels of 4-6 feet above ground level. Although significant storm surge and freshwater flooding was reported on some of the barrier islands, property damage from flooding and high winds was generally minor.

Hurricane Dorian (2019)

Most people remember Dorian for the extreme devastation it caused as the strongest hurricane to hit the northwestern Bahamas in modern recorded history. However, the hurricane also affected a large portion of the U.S. East Coast as it recurved and passed over the western Atlantic Ocean. On its approach to Atlantic Canada, Dorian lost its tropical characteristics and transitioned to a 90-mph post-tropical low. Given Dorian’s significant threat to life and property, the NHC, in coordination with the CHC, decided to continue issuing advisories on the post-tropical cyclone as it neared the Canadian Maritimes. The CHC maintained Hurricane Warnings that were in effect for portions of Atlantic Canada. The NHC Key Messages stressed the significant impacts expected from significant storm surge and hurricane-force winds. Overall, the NHC provided an extra 30 hours of advisories that covered Post-Tropical Cyclone Dorian’s trek across eastern Canada.
As a post-tropical cyclone, Dorian produced extensive wind damage over portions of the Canadian Maritimes, including downed trees and power lines along with roof and siding damage. Heavy rainfall resulted in major flooding, and storm surge accompanied by large waves caused significant coastal erosion. Insurance estimates indicate that Dorian caused over $75 million (USD) in damage across Atlantic Canada.
Hurricane Fiona (2022)


GOES-16 combined visible and infrared satellite images of Fiona on September 22, 2022 at 1800 UTC as a major category 4 hurricane (left), and September 23, 2022 at 1800 UTC shortly before it transitioned to a post-tropical cyclone (right).
Hurricane Fiona made landfall in Guadeloupe, Puerto Rico, the Dominican Republic, and Grand Turk before it turned north-northeastward over the western Atlantic ahead of an approaching frontal system. As the tropical cyclone interacted with the associated mid- to upper-level trough, Fiona lost its tropical characteristics and accelerated toward Atlantic Canada. Due to the significant threat of high winds, storm surge, and large waves that the storm posed to Atlantic Canada, the NHC continued to produce advisories on Fiona and the CHC maintained the Hurricane Warnings in effect. Fiona became an intense 115-mph post-tropical/extratropical cyclone shortly before it reached the coast of Nova Scotia, and it made landfall as the deepest cyclone (by minimum pressure) on record in Canada with maximum sustained winds of 100 mph. Ultimately, the NHC provided an additional 18 hours of advisories on Post-Tropical Cyclone Fiona until the tropical storm and hurricane warnings were discontinued.
Fiona produced devastating impacts across Atlantic Canada as a post-tropical cyclone. Storm surge and large, destructive waves resulted in devastating coastal flooding and significant erosion along the coasts of southwestern Newfoundland, eastern and northern Nova Scotia, Prince Edward Island, eastern New Brunswick, and Iles-de-la-Madeleine. Two people drowned, and over 100 homes were destroyed along the coast of southwestern Newfoundland from Port aux Basques eastward to Burgeo. Elsewhere, strong winds downed thousands of trees and power lines across portions of Nova Scotia, New Brunswick, Prince Edward Island, and Newfoundland. Catastrophe Indices and Quantification Inc. (CatIQ) damage estimates indicate that Fiona is the costliest extreme weather event on record in Atlantic Canada with about $800 million (CAD) in insured losses.
“In some ways, Fiona was Canada’s version of Sandy – a landmark event,” according to Chris Fogarty, Program Manager at the Canadian Hurricane Centre. “Impacts were forecast to be considerable, and the CHC focused on the impacts in the warning statements even after the storm was declared post-tropical.”

Conclusion
The NHC service enhancements discussed in this blog series were the direct result of lessons learned from past events. Sandy was a unique storm that exposed hazard communication and messaging challenges that can arise when a TC becomes post-tropical around the time of landfall. In response, the NWS adopted a policy that attempts to keep the public focus on the warnings and potential impacts of the storm, regardless of its status. Ultimately, our ability to issue full NHC advisory packages on post-tropical cyclones has been successfully utilized in recent years, both domestically and internationally. The examples presented here serve as reminders that post-tropical cyclones can bring significant impacts to land areas, and the associated warnings must be taken seriously.
Footnotes
1 After NHC discontinues advisories, post-tropical cyclones that do not pose a threat to land areas are discussed in High Seas Forecasts issued by NHC’s Tropical Analysis and Forecast Branch (TAFB) and/or the NOAA Ocean Prediction Center (OPC). If an inland system still poses a threat of heavy rains and flash floods in the United States, advisory responsibility is transferred to the NOAA Weather Prediction Center (WPC) until the flash flood threat has ended.
Share this:

An Evaluation of NHC Service Enhancements, Part 1: Potential Tropical Cyclone Advisories
Brad Reinhart, Hurricane Specialist

Tropical cyclone (TC) formation near land is among the more difficult scenarios for forecasters, emergency managers, and the general public to contend with during the hurricane season. In the past, these situations were challenging from a public warning and hazard communication perspective because tropical storm and/or hurricane watches and warnings could only be issued once TC formation occurred. However, National Weather Service (NWS) policy changes in 2017 gave the National Hurricane Center (NHC) the ability to issue Potential Tropical Cyclone (PTC) advisories. These advisories can be initiated when a disturbance is not yet a TC, but poses a threat of becoming a TC and bringing tropical storm or hurricane conditions to land areas within 48 hours. So instead of sacrificing valuable lead time by waiting until TC formation occurs, the NHC can issue the full suite of advisory products (including tropical storm, hurricane, and storm surge watches and warnings) for near-term land threats before genesis occurs.
How often has the NHC employed this strategy? Have PTC advisories improved our ability to effectively warn people in advance of hazardous events? Let’s take a closer look at how PTC advisories have been used in recent hurricane seasons.
Forecaster Considerations
When deciding to initiate PTC advisories, hurricane specialists must weigh several factors. The primary consideration is the likelihood of tropical storm or hurricane-force winds occurring on land within the next 48 hours. If the system is over open waters and does not pose a near-term land threat, PTC advisories will not be issued and potential hazards for marine interests will be covered by marine products and warnings. The disturbance should have a “trackable” cloud system center that allows for some measure of forecast continuity. If the system is so disorganized that a system center cannot be identified, it will be very difficult to issue accurate and consistent pre-genesis forecasts. Another consideration is the disturbance’s potential for tropical cyclone development. Although the issuance of PTC advisories is not directly tied to a system’s formation chance in the Tropical Weather Outlook (TWO), it makes sense that the NHC would only start PTC advisories for systems that they are reasonably confident will become tropical cyclones, as too many false alarms could reduce the long-term effectiveness of our watches and warnings. The scatterplot below shows the 2-day and 5-day1 TWO genesis probabilities at the issuance time of the initial PTC advisory for each system. Note that the size of the marker indicates the frequency of occurrence for a particular pair of 2-day/5-day chances. The 2-day and 5-day TWO formation chances at the initial PTC advisory time all range from 70-100%, which is within the “high” category of the TWO. Most commonly, these disturbances have 2-day formation chances of 80-90% when PTC advisories are initiated, which indicates very high confidence in the near-term formation potential.

Usage of Potential Tropical Cyclone Advisories
From 2017-2022, the NHC issued 116 potential tropical cyclone advisories for 30 different systems – 27 in the Atlantic Ocean and 3 in the eastern North Pacific Ocean (map below). Of the 30 total PTC cases, only three disturbances failed to develop into tropical cyclones. At least three Atlantic PTC cases have occurred each year since 2017. During the 2022 season, PTC advisories were used for five Atlantic disturbances, four of which went on to become tropical cyclones – Alex, Bonnie, Julia, and Lisa.

While the majority of PTC disturbances were producing maximum sustained winds below tropical storm force (30-35 mph) when advisories were initiated, 20% of PTCs were already at tropical storm intensity for the first advisory. These cases were often fast-moving and/or sheared systems that lacked a closed surface circulation and/or enough convective organization to be officially classified as a TC.

The table below provides a summary of how often different watches and warnings were issued with PTC advisories. While tropical storm watches and warnings are most commonly issued with PTC advisories, there have been several instances of hurricane and storm surge watches being issued as well. Additionally, a storm surge warning was issued with a PTC advisory for the system that became Tropical Storm Nestor in 2019. The PTC advisories have been used to issue watches and warnings for both the United States and international locations. In fact, 80% of PTC events have resulted in the issuance of a watch or warning internationally, while 37% have resulted in watch or warning issuance for the United States and its Caribbean territories (Puerto Rico and the U.S. Virgin Islands).

The chart below illustrates the time difference between the issuance of the first PTC advisory for individual systems and the operational designation of those systems as TCs. This is one way to visualize how much earlier forecast and warning information was provided for these developing systems that posed a threat to land. On average, PTC advisories were initiated 18-21 hours before a system was operationally classified as a TC. However, there were a couple of 2022 storms (Bonnie and Alex) where PTC advisories were issued 88 hours and 57 hours, respectively, before genesis occurred. In these situations, the timing of genesis was challenging to forecast and ultimately occurred much later than expected. We will take a closer look at the Alex case later.

Warning Lead Times
We can also examine the lead time for warnings that have been issued with PTC advisories. Here, the lead time is defined as the time between warning issuance and the onset of sustained tropical-storm-force winds on land within the warning area, as determined during post-analysis and detailed in our Tropical Cyclone Reports. For this analysis, we looked at verified Tropical Storm Warnings that were issued with PTC advisories for the United States (including Puerto Rico and the U.S. Virgin Islands). International locations were not included because although NHC makes international watch and warning recommendations, the final decision is made by the national meteorological service or government of the respective countries.
The blue bars represent the actual lead times that were achieved using PTC advisories, while the red bars show the hypothetical lead times if warnings had not been issued until the disturbance became a TC. On average, verified Tropical Storm Warnings that were issued with PTC advisories provided an additional 21 hours of lead time than if PTC advisories had not been used. Sometimes, warnings issued with PTCs provided even more advanced notice. In 2020, a Tropical Storm Warning was issued for Puerto Rico and the U.S. Virgin Islands as the disturbance that became Isaias approached the Lesser Antilles. Although Isaias did not become a tropical storm until it passed south of Puerto Rico, the warning issued with the first PTC advisory provided about 45 hours of lead time before sustained tropical-storm-force winds reached the island.

Case Studies
Hurricane Barry (2019)


GOES-16 true color visible imagery of (left) Potential Tropical Cyclone Two at 1500 UTC July 10, 2019, and (right) Hurricane Barry making landfall at 1500 UTC July 13, 2019.
Barry originated from a non-tropical, mesoscale convective complex that emerged over the northeastern Gulf of Mexico on July 9, 2019. The elongated low pressure system was forecast to acquire tropical characteristics and strengthen over the northern Gulf of Mexico, and the NHC initiated PTC advisories at 10:00 am CDT on July 10 to issue Storm Surge and Tropical Storm Watches for portions of the Louisiana coast. Six hours later, a Hurricane Watch was issued for portions of Louisiana while the disturbance was still classified as a PTC. The disturbance developed into Tropical Storm Barry 24 hours after the first PTC advisory, and it ultimately strengthened into a hurricane shortly before landfall. The usage of PTC advisories allowed the NHC to issue the watches 48 hours before the onset of sustained tropical-storm-force winds along the Louisiana coast. Barry produced $600 million in damage according to NOAA National Centers for Environmental Information (NCEI), primarily in Louisiana due to flooding from heavy rains and storm surge.
Tropical Storm Claudette (2021)


GOES-16 true color visible imagery of (left) Potential Tropical Cyclone Three at 2100 UTC June 17, 2021, and (right) Tropical Storm Claudette making landfall at 0900 UTC June 19, 2021.
Claudette developed from a broad low-pressure system that formed over the southwestern Gulf of Mexico on June 14, 2021. The low meandered over the next couple of days before moving generally northward toward the northern Gulf Coast, but it did not possess a well-defined center or enough organized convection to be classified as a tropical storm. The NHC initiated PTC advisories at 4:00 pm CDT on June 17 to issue a Tropical Storm Warning for the northern Gulf Coast from Intracoastal City, Louisiana, to the Alabama/Florida border. The system remained sheared and somewhat elongated as its ill-defined center approached the Louisiana coastline, and operationally it was not designated Tropical Storm Claudette until early on June 19 when it made landfall along the coast of Terrebonne Parish, Louisiana. The Tropical Storm Warning was issued 21 hours before tropical-storm-force winds reached the Louisiana coast. Although this is less than the desired warning lead time of 36 hours, it is noteworthy because tropical storm conditions were already affecting the coast when Claudette operationally became a TC. Therefore, if the warning had been dependent on TC formation, there would have been no lead time at all! Claudette was responsible for four direct deaths in the United States, and NOAA NCEI estimates that the storm caused $375 million in damage from flooding, tornadoes, and gusty winds.
Potential Tropical Cyclone One / Tropical Storm Alex (2022)

On June 2, 2022, the NHC began issuing PTC advisories on a broad low-pressure area over the southern Gulf of Mexico near the Yucatan Peninsula. The system was forecast to move northeastward, gradually strengthen and become better organized, and eventually develop into a tropical storm before it moved across South Florida. This warranted the issuance of Tropical Storm Watches and Warnings for portions of western Cuba, the Florida Keys, and the Florida peninsula. But over the next couple of days, the center of the disturbance remained poorly defined, and the shower and thunderstorm activity failed to become more organized due to strong westerly vertical wind shear. As a result, the system did not become a TC before it reached the southwestern coast of Florida on the morning of June 4. In fact, the disturbance did not become Tropical Storm Alex until it crossed the Florida peninsula and moved over the southwestern Atlantic Ocean later that evening.
Although the disturbance was not a TC when it impacted Cuba and South Florida, the early NHC advisories heightened awareness and enhanced the messaging of a wind and flooding threat for these locations. The disturbance caused four flood-related fatalities in Cuba. Widespread flash and urban flooding, along with tropical-storm-force wind gusts, occurred across portions of South Florida, including the Miami metropolitan area. In this case, the status of the system as it impacted Florida was less important than the enhanced messaging that the NHC provided to the public through its use of PTC advisories.
Conclusion
The NHC has leveraged PTC advisories to address some of the challenges posed by TCs developing near land. This approach has maintained consistent hazard messaging during the developmental stages of TCs near land and increased watch and warning lead times to facilitate preparedness actions. The cases presented here are just a few examples of how the NHC has successfully used PTC advisories to provide better service to those who are threatened by these types of storms. Occasionally, there are still systems that undergo unlikely or unexpected genesis near the coast, resulting in short-fused warnings. However, the usage of PTC advisories and continued improvements in TC genesis forecasts should hopefully reduce these occurrences going forward.
Part 2 of this blog series will explore how the NHC has used advisories on post-tropical cyclones to maintain consistent warnings and hazard messaging for systems that are no longer officially classified as TCs, but continue to pose a significant land threat.
Footnotes
1 Beginning in 2023, NHC has extended the forecast time period covered by the TWO from 5 to 7 days. https://www.nhc.noaa.gov/pdf/NHC_New_Products_Updates_2023.pdf
Share this:

After Further Review: Tropical Storm Erika

Tropical Storm Erika, coming as it did so close to the beginning of the new college and professional football seasons, is a reminder that Monday-morning quarterbacking is nearly as popular an activity as the sport itself. And we at NHC do it too. After every storm we review our operations with an eye toward improving our products and services. Erika is no different, though there’s been more questioning and criticism than usual, with few components of the weather enterprise spared. Some in the media were accused of overinflating the threat, numerical models were bashed, and some public officials were charged with overreacting. NHC’s forecasts were questioned while others lamented that NHC’s voice wasn’t strong enough amid all the chatter. So, in the spirit of searching for a tropical storm eureka, in this blog entry we present some of our own post-storm reflections.
How good were NHC’s forecasts for Erika?
The NHC official forecast errors were larger than average. A preliminary verification shows that the average 72-hr track error for Erika was 153 n mi, about 30% larger than the 5-year average of 113 n mi. And nearly all of this error was a rightward (northward) bias – that is, Erika moved consistently to the left of the NHC forecast track. As for intensity, Erika ended up being weaker than forecast; the 72-hr intensity forecasts were off by about 20 kt on average, and the official 5-day forecasts called for a hurricane over or near Florida until as late as 2 AM Friday, when it became clear that Erika was going to have to deal with the high terrain of Hispaniola.
Why was Erika so difficult to get right?
Erika was a weak and disorganized tropical cyclone, and weak systems generally present us (and the computer simulations we consider) with tougher forecast challenges. In fact, the average 72-hr track error for all tropical depressions and weak tropical storms is around 155 n mi – just about exactly what the errors for Erika were. So the track issues weren’t really a surprise to us. Of course, knowing whether such errors were going to occur and how to reduce them in real time wasn’t obvious. If it had been obvious, we would have called an audible and changed the forecast.
 What made this particular situation so challenging was wind shear, mainly due to strong upper-level westerly winds in Erika’s environment. These winds tended to displace the storm’s thunderstorms away from its low-level circulation, causing the storm to lack a coherent vertical structure. When this happens, it’s very difficult to tell just how much influence those upper-level winds will have on the storm track. Sometimes storms hold together against wind shear (Andrew of 1992 is a good example), and there were times when Erika seemed to be winning its battle. If it had held together better, it would have taken a track more to the north and ended up being a much stronger system. Obviously, it didn’t play out that way, but that was an outcome far easier to see with the benefit of hindsight.
An additional complication was Puerto Rico and Hispaniola. If Erika had been able to avoid those land masses, it would have been better able to withstand the disruptive effects of wind shear. And early on, we expected Erika to mostly avoid land. In this case, not getting the track right made it much harder to get the intensity right, which made the track forecasts harder yet.
Is there too much reliance on numerical models, and did they fail for Erika?
The improvements in track forecasting over the past few decades are directly attributable to improvements in numerical models, and to the data used to initialize them, to the point where it’s become almost impossible for a human forecaster to consistently outperform the guidance. The modelling community deserves our praise for the tremendous progress they’ve made, not criticism for missing this one. While we approach each forecast with an attempt to diagnose when and how the models might fail, it is exceedingly difficult, and it’s not something we do in our public forecasts unless our confidence is very high.


Human forecasters (including those at NHC) are still able to occasionally outperform the intensity models, mainly because satellite depictions of storm structure can often be used by forecasters more effectively than by models, giving us an edge in certain circumstances. But neither human forecasters nor the models are particularly good at anticipating when thunderstorms in the cyclone core are going to develop and how they’re going to subsequently evolve, especially for weaker cyclones like Erika.
Because the atmosphere is a “chaotic” physical system, small differences in an initial state can lead to very large differences in how that state will evolve with time. This is why the model guidance for Erika was frustratingly inconsistent – sometimes showing a strong hurricane near Florida, while at other times showing a dissipating system in the northeastern Caribbean. It’s going to take a large improvement in our ability to observe in and around the tropical cyclone core (among other things), to better forecast cases like Erika for which storm structure is so important to the ultimate outcome. But our best hope for better forecasts lies in improved modeling–a major goal of the Hurricane Forecast Improvement Program (HFIP).
Given the overall model guidance we received during Erika, it’s hard even now, well after the storm, to see making a substantially different forecast with current capabilities and limitations. In fact, had our first few advisories called for a track much farther south at a much weaker intensity, or even a forecast of dissipation due to interaction with Hispaniola, our partners and the public might rightly have questioned our rationale to go firmly against many model forecasts of a stronger system farther north.
Was the message from NHC muddled?
We think that there might be some ways for NHC to make key aspects of our message easier to find. Although NHC’s Tropical Cyclone Discussions (TCDs) repeatedly talked about the uncertainty surrounding Erika’s future beyond the Caribbean, including the possibility that the cyclone could dissipate before reaching Florida, it does not appear that this was a prominent part of the media’s message to Florida residents. Making key “talking points” more distinctly visible in the TCD and the Public Advisory are options we are considering, as well as enhanced use of NHC’s Twitter and Facebook accounts. Having said that, consumers and especially re-packagers of tropical cyclone forecast information, like our media partners, should take some responsibility for making use of the information that is already available. We also invite our media partners to take more advantage of the numerous training sessions we offer, mostly during the hurricane offseason. Reaching anyone in the television industry with such training, except for on-camera meteorologists, has proven over the years to be very difficult. We would like to train more reporters, producers, news department staff, executives, etc. so they are more sensitized to forecast uncertainty and how to communicate it with the help of our products, but we realize that a more focused “talking points” approach as described above will probably be needed to assist these busy folks in conveying a consistent message.
An NHC advisory package contains a variety of products, each geared to providing a certain kind of information or to serving a particular set of users. Some of our media partners have expressed concerns over the increasing number of NHC products, but the various wind and water hazards posed by a tropical cyclone cannot be boiled down to one graphic, one scale, or one index. We are, in fact, still in the process of intentionally expanding our product and warning suite to focus more on the individual hazards and promote a more consistent message about those hazards. Even so, two of our products that have been around for many years are still crying out for greater visibility.
We’ve already mentioned the Tropical Cyclone Discussion, a two- to four-paragraph text product that is the window into the forecaster’s thinking and provides the rationale behind the NHC official forecast. In the TCD we talk about the meteorology of the situation, indicate our level of confidence in the forecast, and when appropriate, discuss alternative scenarios to the one represented by the official forecast. Anyone whose job it is to communicate the forecast needs to make the TCD mandatory reading on every forecast cycle.
Some users may not understand the amount of uncertainty that is inherent in hurricane forecasts (although we suspect Florida residents now have a greater appreciation of it than they had two weeks ago). We need to continue to emphasize, and ask our media partners to emphasize, NHC’s Wind Speed Probability Product, available in both text and graphical form, which describes the chances of hurricane- and tropical-storm-force winds occurring at individual locations over the five-day forecast period. Someone looking at that product would have seen that at no point during Erika’s lifetime did the chance of hurricane-force winds reach even 5% at any individual location in the state of Florida, and that the chances of tropical-storm-force winds remained 50-50 or less. In addition, in some of the number crunching we did after the storm, we calculated that the chance of hurricane-force winds occurring anywhere along the coast of Florida never got above 21%.


We realize that at first it seems counterintuitive that we are forecasting a hurricane near Florida while no one in that state has even a 5% chance of experiencing hurricane-force winds. That, however, is the reality of uncertainties in 5-day forecasts, especially for weaker systems like Erika, and the wind speed probabilities reliably convey the wind risk in each community. We did notice a couple of on-air meteorologists referencing the Wind Speed Probabilities, which is great – and the more exposure this product gets, the better. We would like to work with our television partners to help them take advantage of existing ways for many of them to easily bring the wind speed probabilities into their in-house graphics display systems.
A very nice training module exists for folks interested in learning about how to use the Wind Speed Probabilities: https://www.meted.ucar.edu/training_module.php?id=1190#.VenooLQ2KfQ. You will need to register for a free COMET/MetEd account in order to access the training module.
Did Floridians over-prepare for Erika?
Anyone who went shopping for water and other supplies once they were in the five-day cone did exactly the right thing (of course, it’s much better to do that at the beginning of hurricane season!). Being in or near the five-day cone is a useful wake-up call for folks to be prepared in case watches or warnings are needed later. But as it turned out, no watches or warnings were ever issued for Florida. In fact, at the time when watches would normally have gone up for South Florida, NHC decided to wait, knowing that there was a significant chance they would never be needed – and that turned out to be the right call.
Watches (which provide ~48 hours notice of the possibility of hurricane or tropical storm conditions) and warnings (~36 hours notice that those conditions are likely) seem to be getting less attention these days, with the focus on a storm ramping up several days in advance of the first watch. While the additional heads-up is helpful, we worry about focusing in on specific potential targets or impacts that far in advance. The watch/warning process begins only 48 hours in advance because that’s the time frame when confidence in the forecast finally gets high enough to justify the sometimes costly actions that an approaching tropical cyclone requires. (Although, we recognize that some especially vulnerable areas sometimes have to begin evacuations prior to the issuance of a watch or a warning, and we and the local Weather Forecast Offices of the National Weather Service directly support emergency management partners as they make such decisions.)
What can NHC do better next time?
While we’d like to make a perfect forecast every time, we know that’s not possible. Failing that, we’re thinking about ways we can improve the visibility of our key messages, particularly those that will help users better understand forecast uncertainty. As noted above, we’re considering adding a clearly labeled list of key messages or talking points to either the TCD or the Tropical Cyclone Public Advisory, or both. We’d also like to try to make increased use of our Twitter accounts (@NHC_Atlantic, @NWSNHC, and @NHCDirector), which so far have been mostly limited to automated tweets or to more administrative or procedural topics. We’re also looking at whether the size of the cone should change as our confidence in a forecast changes (right now the cone size is only adjusted once at the beginning of each season), and thinking about ways to convey intensity uncertainty on the cone graphic. But most of all, we need to keep working to educate the media and the public about the nature of hurricane forecasts generally, and how to get the information they need to make smart decisions when storms threaten.
— James Franklin
Share this:

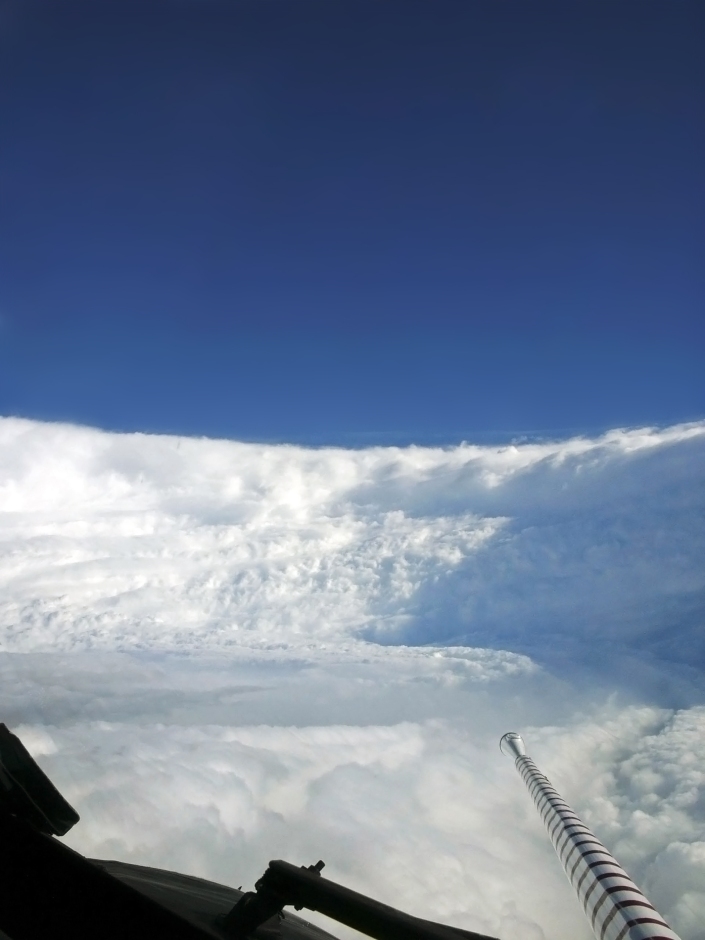
The View from Inside the Eye
Welcome to “Inside the Eye,” the official blog of the National Hurricane Center!
Why have we launched a blog? The staff at the National Hurricane Center (NHC) regularly conducts training and educational workshops during the off season for specific audience groups, including emergency managers and other meteorologists. However, despite our heavy emphasis on outreach, there is always a large segment of the population that does not have the opportunity to hear from us in person on important changes to NHC products or discuss topics related to tropical and marine weather events. Therefore, we’ve launched this blog to be able to keep you, our partners and customers, more informed on a consistent and timely basis.
The National Hurricane Center has long had a vision of being America’s “calm, clear and trusted voice in the eye of the storm.” Much like the NOAA Hurricane Hunter aircraft in the picture to the right, we also want you to have a view from inside the eye. We want you to see what’s happening at the Hurricane Center before, during, and after a storm. We also want to help you understand how to interpret our forecasts so that even when there is a hurricane, you will have a clear understanding of what to expect and plan for.
Stay tuned for blog posts in the coming weeks. We have some big forecast product launches coming up this hurricane season, including an experimental potential surge surge flooding map and an extended 5-day graphical tropical weather outlook, and we plan to use the blog to provide information on the background and interpretation of these products. In addition, our staff has a wide range and diversity of expertise, so you can expect to see blog posts on many different subjects as we go forward. You may even see an occasional guest blog post from experts outside of NHC.
If you’d like to follow our blog and receive updates on blog posts, you can sign up to receive email notifications at the bottom of the column on the right. We also plan to advertise new posts on our various Twitter and Facebook accounts.

