Author: Robbie Berg
Storm Surge: Planning for the Risk
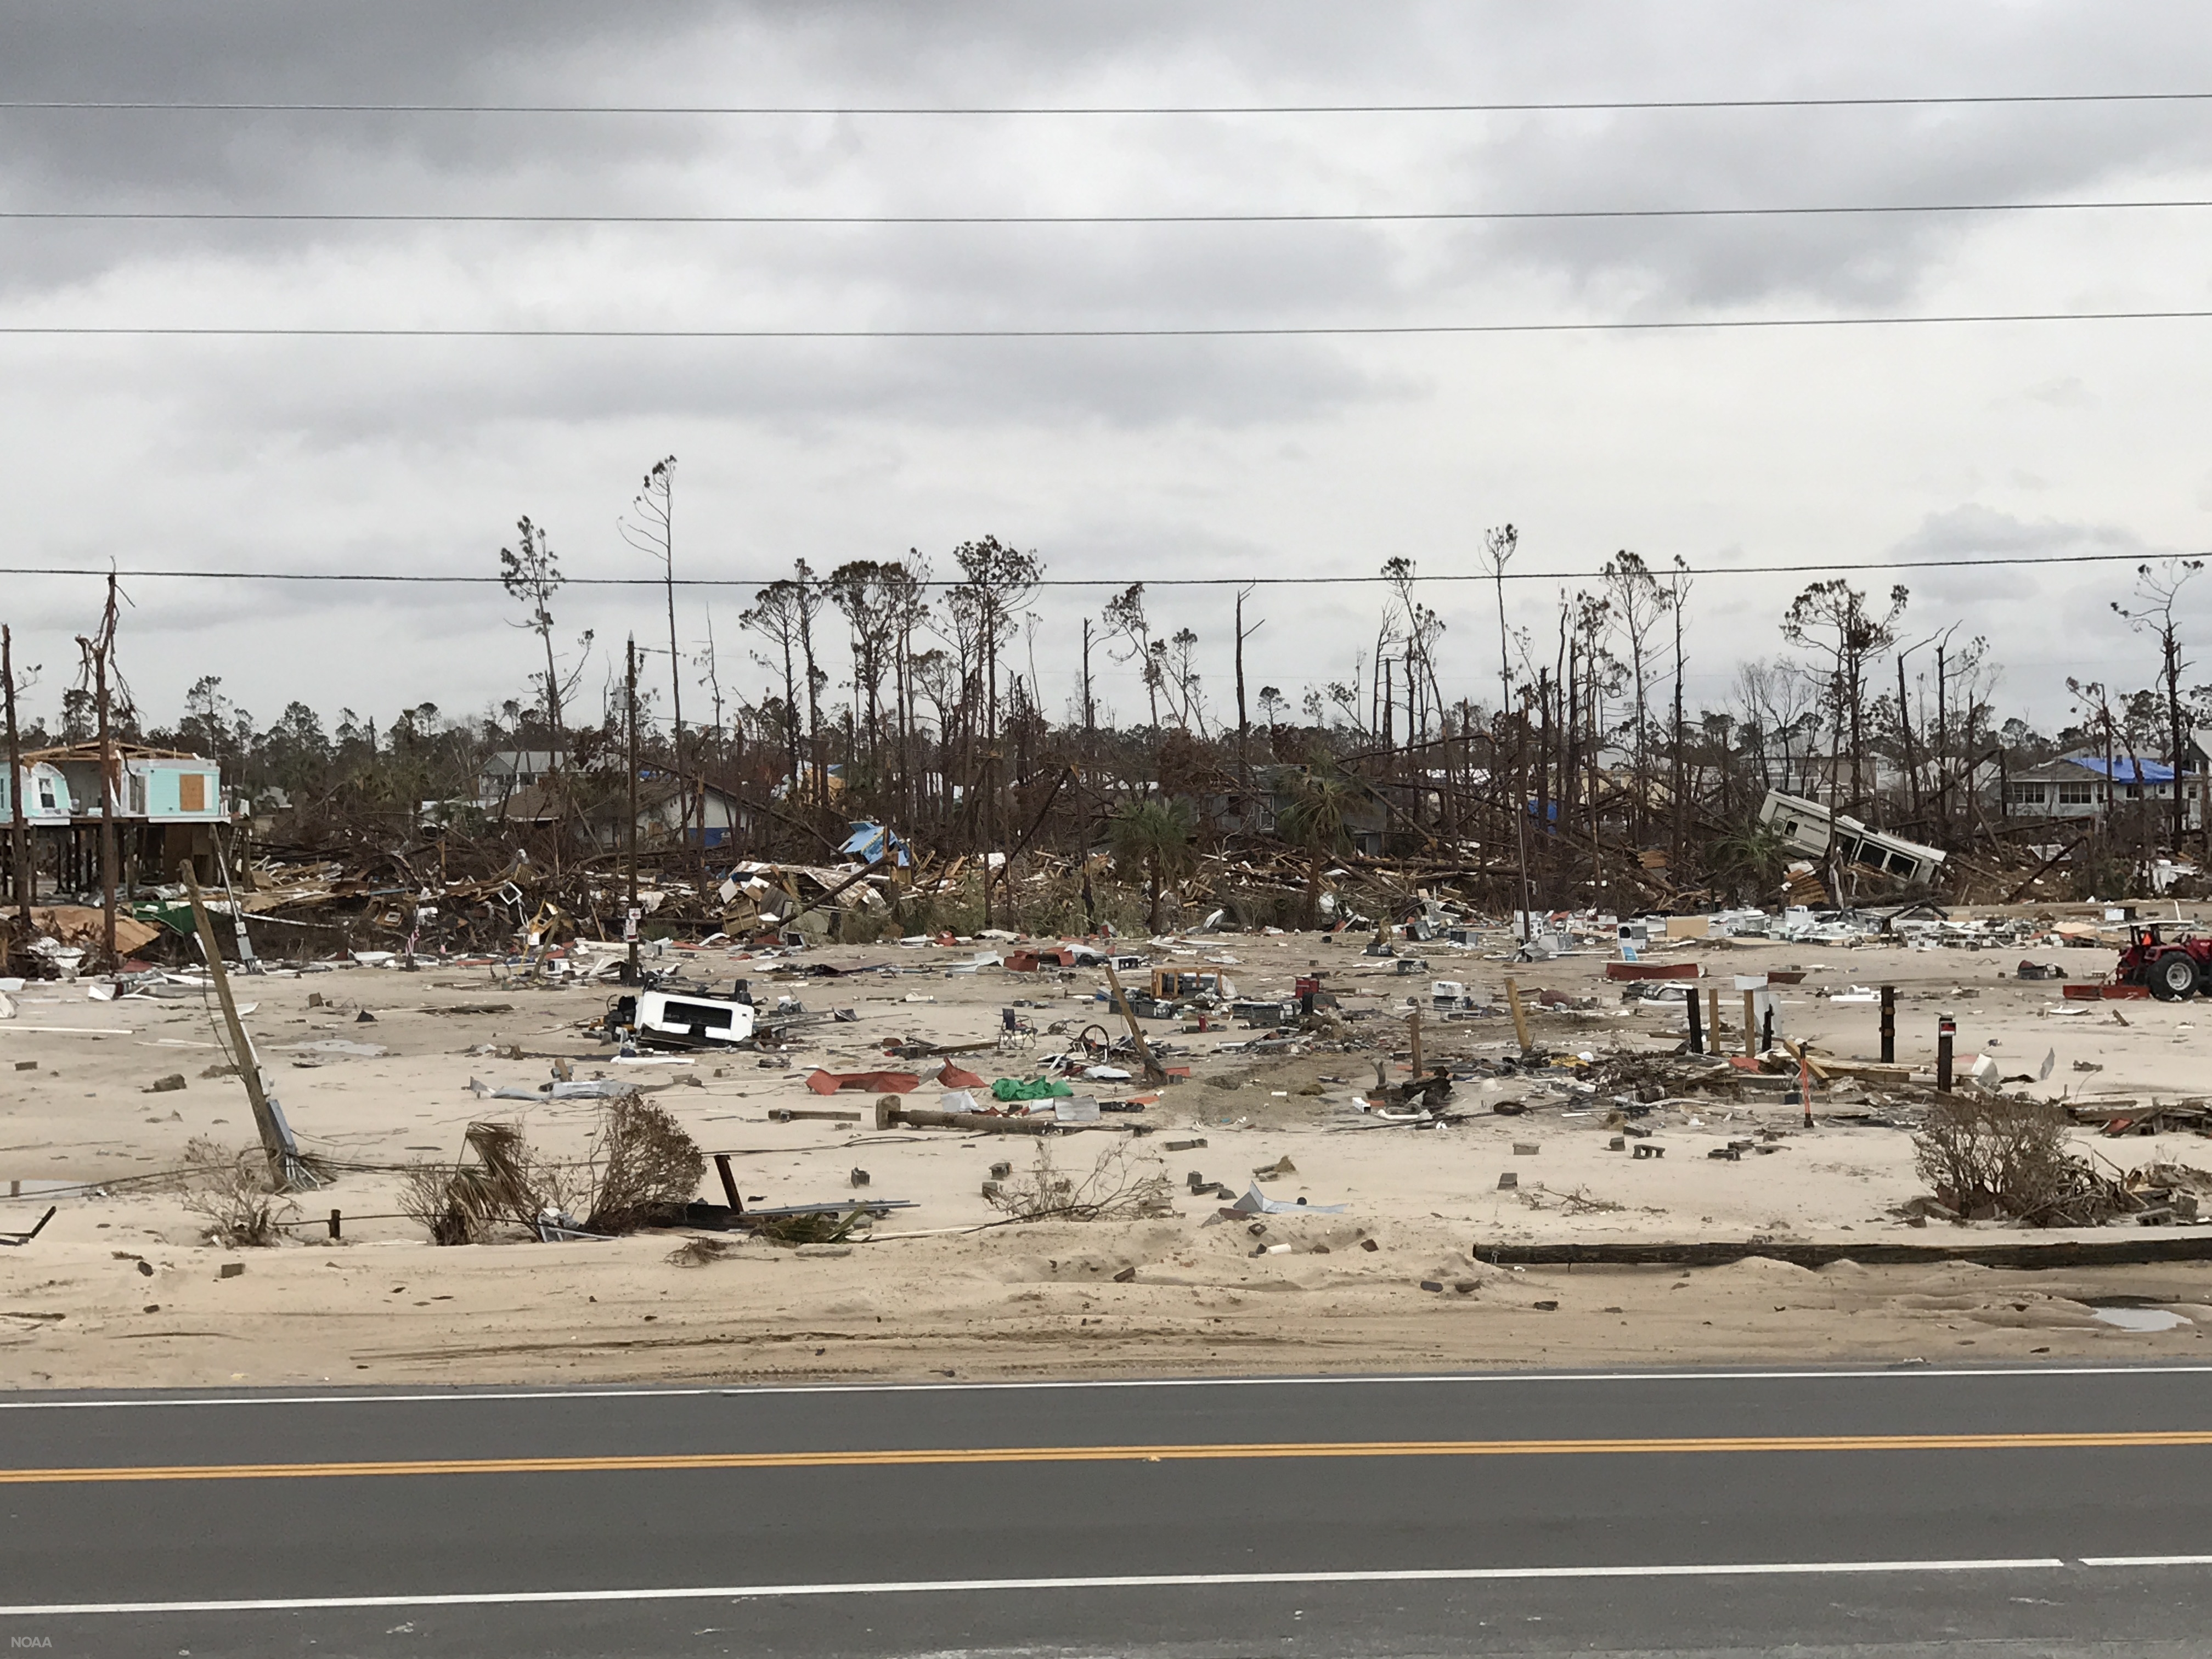
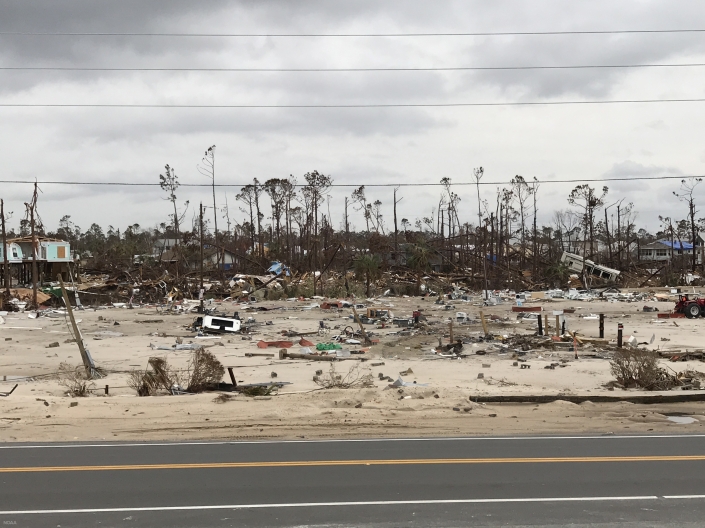 Mobile home park on the north side of U.S. Highway 98 in Mexico Beach, Florida, washed away by the storm surge and wave impacts of Hurricane Michael. Nov. 2, 2018 (NOAA)
If you were asked to define the word “risk”, what would your response be? What are the first things that come to mind? What questions are you asking? What are some things you would consider to be risky? Risk can take many forms, be it financial, personal injury, or even simple decisions that we all have to make on a daily basis. Consider two simple questions:
- Should I change the tires on my car?
- Should I change the tires on my car today
From a risk perspective, how has the question changed? The answer to the first question is a simple one because it’s general in nature. Yes, the tires should be changed somewhat routinely over the lifetime that you own or lease the car. Question two requires more thought, however, because it narrows the task down to a specific time frame. If your tires were changed recently and are in good shape, then it’s most likely business as usual. If you’re overdue, what are the potential consequences of not having your tires changed? Are you risking personal injury to yourself, your family, or others by not changing them? The risk profile changes based on myriad variables that exist. As this example conveys, the idea of risk is relatively simple in itself but can become complex quickly. Let’s define risk for now as the potential of gaining or losing something of value. That is to say:
Risk = Probability x Consequence
Yes, we threw some math at you, but this concept is relatively easy to grasp. Using the previous example, the overall risk profile is determined by multiplying the probability of a given event by the resulting consequence if that event occurs. So if there is a high chance of an event occurring, or the consequence is severe, then the risk to you would be high. One way to look at risk is by using a risk matrix, as shown below in Figure 1. Your risk increases if the probability of the event goes up or if the consequence of the event goes up.
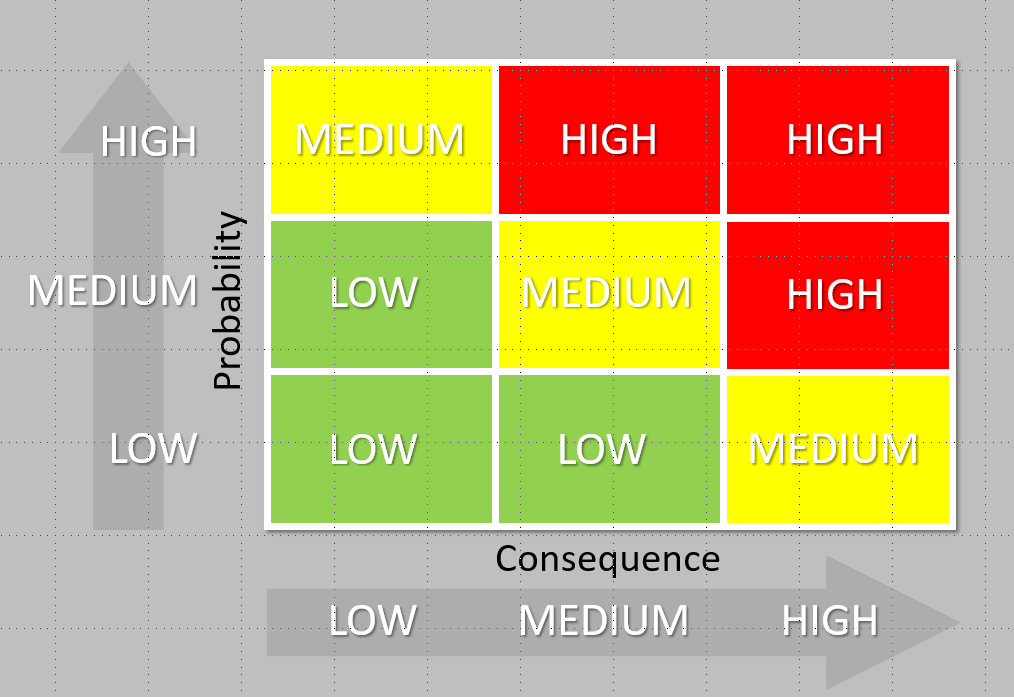
Figure 1. Risk matrix showing different levels of risk based on the probability of an event and the consequence if that event occurs.
The event in our car example is blowing a tire on the interstate, and a potential consequence would be having a fatal accident due to the blown tire. That consequence is so severe that your risk is quite high. But let’s take the example a little further. Risk is further compounded by vulnerability. Let’s consider a new equation:
Risk = Probability x Consequence x Vulnerability
Using the same example, what are variables that could increase the vulnerability, and thus the risk of a fatal accident, in this scenario? Are there kids in the car? What speed is the car travelling? If the tire pops while backing out of the driveway, isn’t that much different than the tire popping while travelling 70 mph down a busy interstate? This is just one of many examples that we all encounter on a daily basis. If there is a consequence to an action you might take, then you are making a risk-based decision.
Risk Perception and Risk Tolerance
There are two other topics related to risk that we should touch on: risk perception and risk tolerance. First, risk perception is the subjective judgement people make about the severity and probability of a risk. Why is this important? Well, there are two main reasons:
- Actual risk usually doesn’t equal perceived risk
- Perceived risk varies from person to person
Why does this complicate matters? When people have to make decisions, it’s important that how they perceive the risk be equal to the actual risk of the event, or at least as close to equal as possible. This is especially true when there is a desired response or action that needs to be taken to protect life and property, as is often the case with weather. We can use a simple example to further understand this. If a tornado is on the ground moving towards a community, the desired action for people living within that community is to seek shelter. In this scenario, the cost of persons within that community not seeking shelter is very high given that their lives are potentially in peril. If people dismiss what that tornado could do to their community (e.g., “tornadoes always pass our city to the south”), then that can be a recipe for disaster, especially when the cost is human lives.
This leads us nicely into risk tolerance. How an individual responds to risk is governed by their risk tolerance, which is unique to both the situation and the person. Risk tolerance is the amount of risk that an individual is willing to accept with respect to a given event occurring. Turning back to the tornado example, let’s consider two hypothetical people that live in the community threatened by the approaching tornado; we’ll name them Sara and Monika. For the sake of example, let’s assume that Sara has a family with two young children and lives in a mobile home. Monika, on the other hand, lives by herself in a well-built house. If Sara and Monika have the same perception of the imposing risk, do these life factors change their respective risk tolerances? In the real world it’s difficult to say, but in this idealized example, let’s assume that it does. Monika does not have anyone in her care and also lives in a home that could withstand stronger winds than Sara’s mobile home. Is Monika’s tolerance for risk higher than Sara’s? It certainly could be, couldn’t it? Again, we understand that assumptions are being made here, but this is simply a hypothetical scenario to demonstrate how risk tolerances may change across individuals and circumstances unique to those individuals. All of this is to say that humans are complicated and risk perceptions and tolerances vary across all of us.
Circling back to the initial equation that we used to define risk, let’s establish a baseline for what the potential consequences are with respect to storm surge by looking at history. Storm surge is the abnormal rise of the ocean produced by a hurricane or tropical storm, and normally dry land near the coast can be flooded by the surge. Historically, about 50% of lives lost in landfalling tropical cyclones in the United States have been due to storm surge (Figure 2):
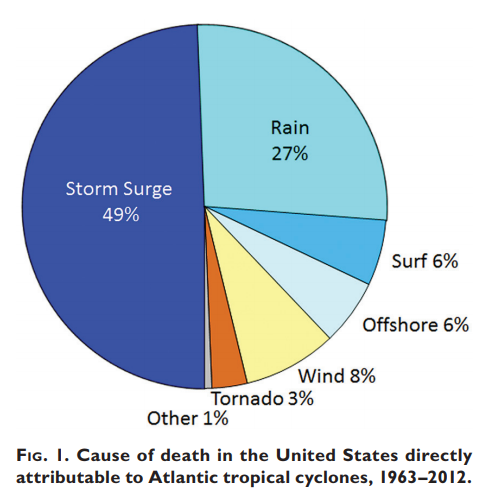
Figure 2. Causes of death in the United States directly attributable to Atlantic tropical cyclones, 1963-2012 (Rappaport 2014).
The mission statement of the National Weather Service charges us to “provide weather, water, and climate data, forecasts and warnings for the protection of life and property and enhancement of the national economy.” There is no clearer way to illustrate what the consequences are in this equation: the loss of human lives. Because the cost here is so high – arguably the highest – our risk tolerance for your safety is extremely low. We have absolutely no appetite for someone losing their life from a weather event. This idea directly informs many of the products that we use to communicate risk prior to and during landfalling storms, and we therefore use near-worst-case scenarios to encapsulate the full envelope of storm surge risk to communities. One life lost during a storm is one life too many. The remainder of this blog post will discuss two such products used by the National Hurricane Center and emergency managers to understand storm surge risk.
MOMs and MEOWs
Can we all agree that “MOMs” are extremely important? Well, yes, those moms are important in our lives, but that holds true for storm surge MOMs as well. Have you ever wondered how officials decide what areas should evacuate ahead of a hurricane? Look no further. MOMs (Maximum of the Maximums) are the rock from which the nation’s storm surge evacuation zones are built upon. MOMs are generated ahead of time. That is to say that these are precomputed maps meant for planning and mitigation purposes well ahead of a landfalling hurricane. In fact, one can view these any time as they are hosted on the National Hurricane Center’s website at https://www.nhc.noaa.gov/nationalsurge/. MOMs are generated by hurricane category (think 1-5) and depict the maximum storm surge height possible across all storm surge attributes. Attributes include things such as forward speed, storm trajectory, and landfall location, just to name a few. Because this product is designed for planning, you can think of the MOM as a worst-case scenario for a given category of a storm. MOMs do have limitations, however. Remember at the beginning of this post we asked the question “should I change the tires on my car?” MOMs are similar to that question because they are general in nature in that they lump all types of hurricanes into a single category. They can tell you what type of storm surge risk you would have from a category 3 hurricane, for example, but they’re not quite as helpful if you know that the category 3 hurricane will be moving toward the west (and not north or northeast for instance).
For this reason, the MOMs have a slightly more refined counterpart – MEOWs (Maximum Envelope of Water). MEOWs are like the second question we asked: “should I change the tires on my car today.” Since we said “today,” we know a little bit more about the actual situation we’re dealing with to make a better-informed decision. Similarly, once a storm or hurricane forms and is within 3–4 days of impacting the coast, we have at least some idea of how strong it could get, how fast it’ll be moving, and in what general direction it’s headed. We are able as forecasters to whittle down the worst-case MOM such that we only consider storms moving toward a particular direction at a particular forward speed — not all directions and forward speeds. Similar to the Maximum of Maximums, a MEOW is a worst-case for storms of a certain strength (for example, Category 3 hurricanes), but it’s more representative of what the storm surge at individual locations could be based on the attributes and forecasts of the active tropical cyclone. At 3 days out, there is still considerable forecast uncertainty, so the MEOW is meant to supplement the MOM, not replace it. As some might say, you can’t go wrong if you always trust your mom. The same adage goes for a hurricane storm surge MOM.
Hurricane Florence
To help us better understand these products, let’s look at how they could have been used in practice during a past landfalling hurricane. Hurricane Florence made landfall along the North Carolina coast on Friday, September 14th of 2018 and presented numerous forecast challenges, as many landfalling tropical cyclones typically do. One benefit of using MOMs and MEOWs to plan, especially at longer lead-times, is that they provide stability in a situation where the forecast of the storm itself can often change quickly from advisory to advisory. Let’s take a look at what Florence’s forecast looked like about 5 days out from an expected landfall. Figure 3 is taken from the official forecast from the National Hurricane Center on September 8th at 11 pm AST.
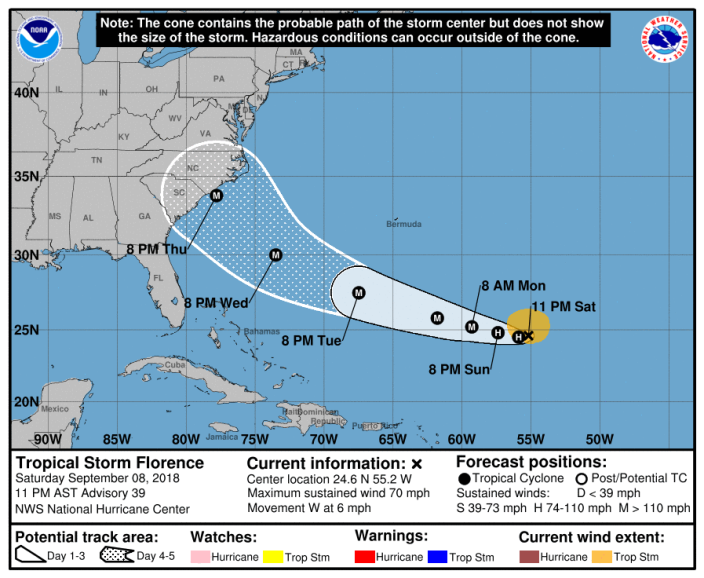 Figure 3. NHC five-day forecast track and cone of uncertainty issued for Tropical Storm Florence at 11 PM AST September 8, 2018 (Advisory 39).

At this point, the information we know is that a potential major hurricane is roughly 5 days away from impacting some portion of the Mid-Atlantic or southeast coast. This is a good point to begin looking at the MOMs. Florence at this point is forecast to be a category 4 hurricane at landfall, so a good rule-of-thumb to follow is to look at a MOM one category higher than the forecast intensity. Let’s take a look at the Category 5 MOM to get an idea of a worst-case storm surge scenario for a portion of the North Carolina coast. You can find that image below in Figure 4.
 Figure 4. Category 5 storm surge Maximum of Maximums (MOM) for portions of eastern North Carolina.

Given how strong Florence could be, it’s no surprise to see potential inundation that would be catastrophic. Remember what we are looking at here and also that this is still a planning tool. This graphic is showing you the worst-case scenario from a Category 5 hurricane. That is to say that these are the highest possible inundations at each individual location for any given storm attribute. We actually shouldn’t expect to see these types of inundation values across the entire area, but given the uncertainties in the storm, all locations in this area should be prepared for these types of inundation values. It would also be prudent to consider looking at other MOMs as well, for context. For example, viewing the Category 3 and 4 MOMs gives context if Florence was to reach the coast at a lower intensity.
Good. Now let’s fast forward by 2 days. We are now 3 days out from a potential landfall. Forecast confidence has increased, but the fine-scale details are still quite blurry regarding the exact location of landfall and how strong Florence will be. But this is when you can begin to turn to the MEOWs. From this point, we can begin to whittle down the MOMs to generate a more realistic potential scenario based on the information currently available. Below in Figure 5 is the forecast from September 10th at 11 pm AST.
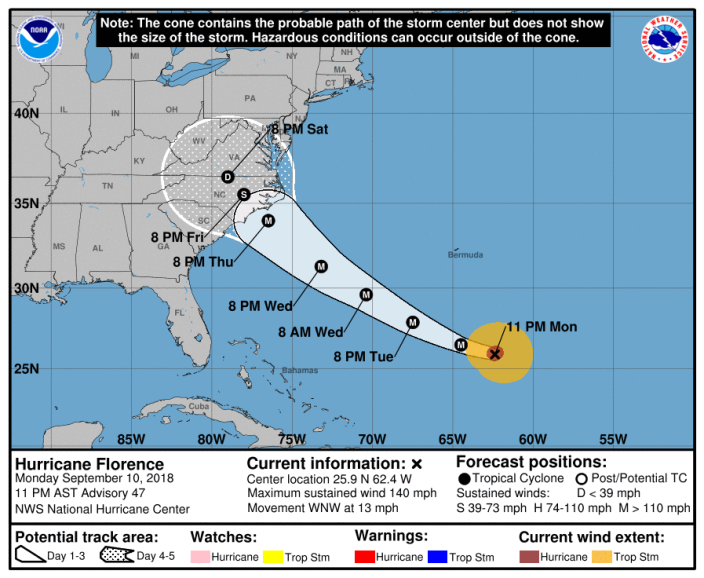 Figure 5. NHC five-day forecast track and cone of uncertainty issued for Hurricane Florence at 11 PM AST September 10, 2018 (Advisory 47).

As you can see, there are some updates to the forecast track. The official forecast now calls for Florence to slow down significantly as it approaches the North Carolina coast. Let’s now talk about which MEOWs we should be looking at and explore how we select them. This is an important junction in the forecast because right now we need to evaluate what we do know, what we don’t know, and what we can and cannot rule out. Remember that MEOWs are generated individually for a particular storm category, forward speed, trajectory, and initial tide level. At this point, is there anything that we can rule out in terms of unrealistic directions that Florence could potentially make landfall? It’s ok to acknowledge that there remains some subjectivity here, but it needs to be an informed decision with an understanding that our risk tolerance is low. That being said, let’s go ahead and rule out some storm directions. Since the forecast track in advisory 47 reflects a northwestward trajectory at landfall, we’ll select that direction, as well as the two surrounding it (west-northwest and north-northwest) to account for uncertainty. How about the intensity? The latest forecast still shows Florence reaching the coast as a category 4 hurricane, so we still need to account for the possibility that it makes landfall one category stronger (category 5). Lastly, let’s consider the speed at which Florence is moving and will be moving near its landfall. The tropical cyclone forecast discussion from advisory 47 explicitly mentions that Florence is expected to decrease in forward speed as it approaches the coast:
“After that time [48 hours], a marked decrease in forward speed is likely as another ridge builds over the Great Lakes to the north of Florence.”
This is reflected in the official forecast which slows Florence down to less than 10 mph near the coast. While this certainly complicates the forecast, the beauty of using MEOWs is that it allows you to compensate for this forecast uncertainty. In this case, it’s fair that we could eliminate the MEOW forward speeds of 15, 25 and 35 mph, given forecaster confidence in Florence’s slow down. This leaves us with a forward speed of 5 mph (only a certain set of speeds is actually available to select).
Let’s quickly recap the parameters that we’ve settled on to generate our MEOW:
Intensity: Category 5
Direction/trajectory: Storms that are moving West-Northwest, Northwest, or North-Northwest
Forward Speed: 5 mph
Tide-level: High (this will always be the assumption)
Using those parameters, Figure 6 shows the potential storm surge inundation that could occur across eastern North Carolina:
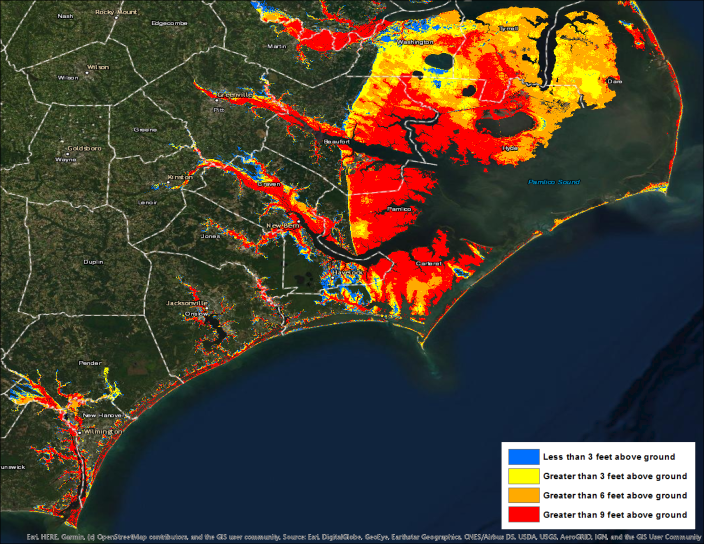 Figure 6. Composite storm surge Maximum Envelope of Water (MEOW) over portions of eastern North Carolina for a category 5 hurricane moving west-northwest, northwest, or north-northwest at 5 mph at high tide.

To take this one step further, let’s zoom in around the New Bern, North Carolina, area and do a quick comparison of the category 5 MOM that we initially used 5 days out and compare it to the composite of MEOWs (Figure 7).
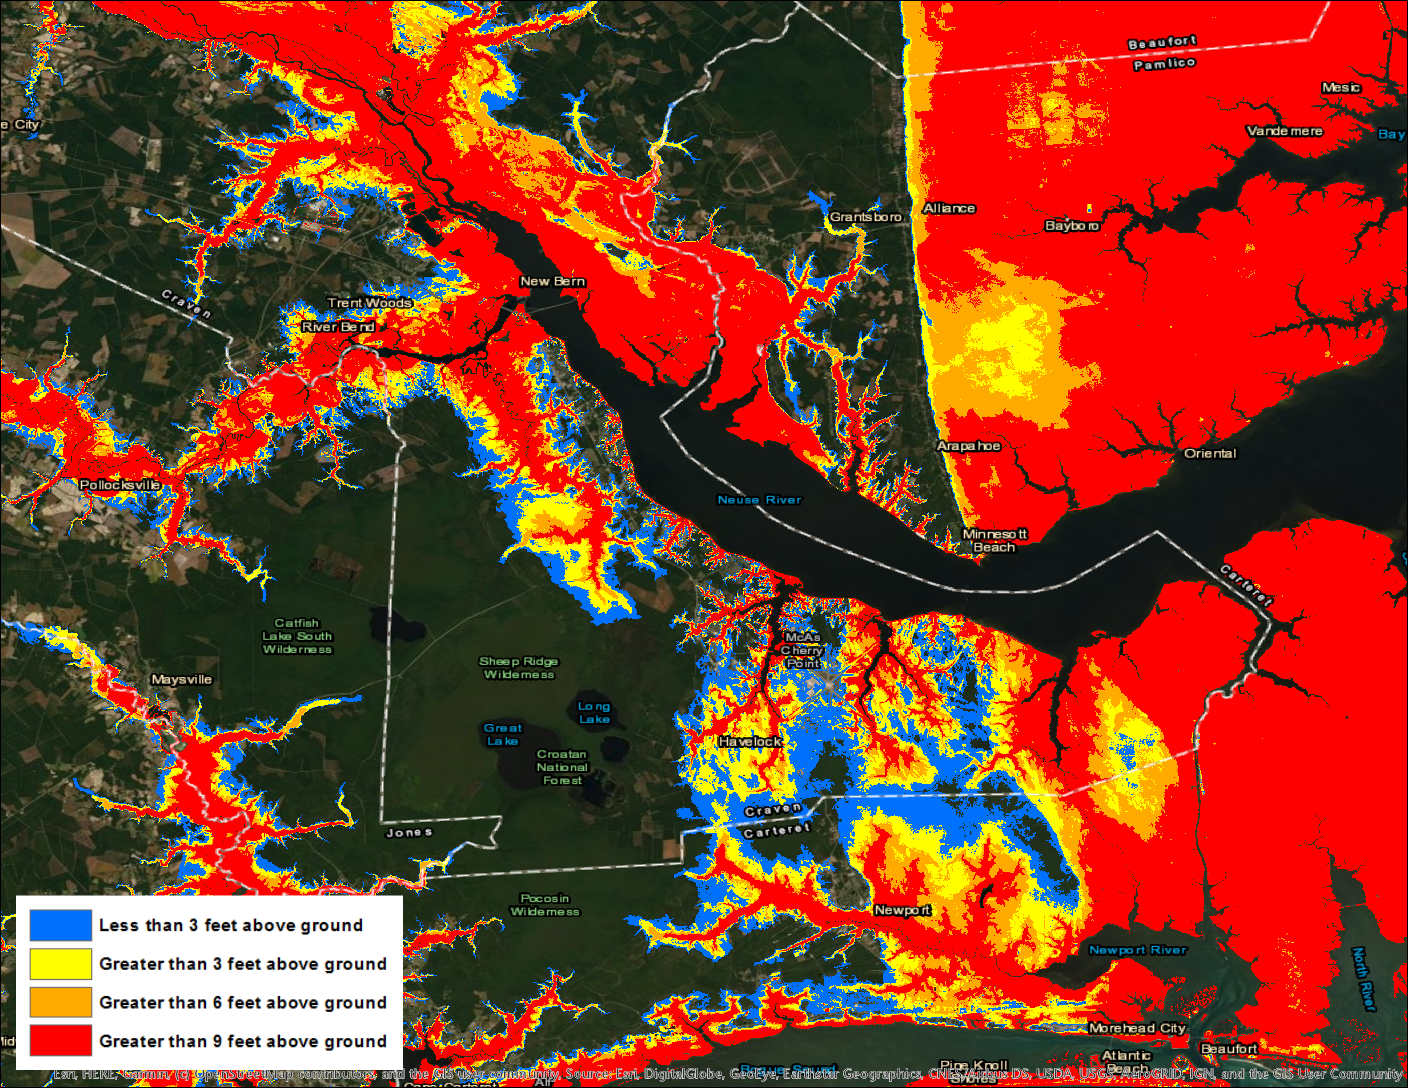
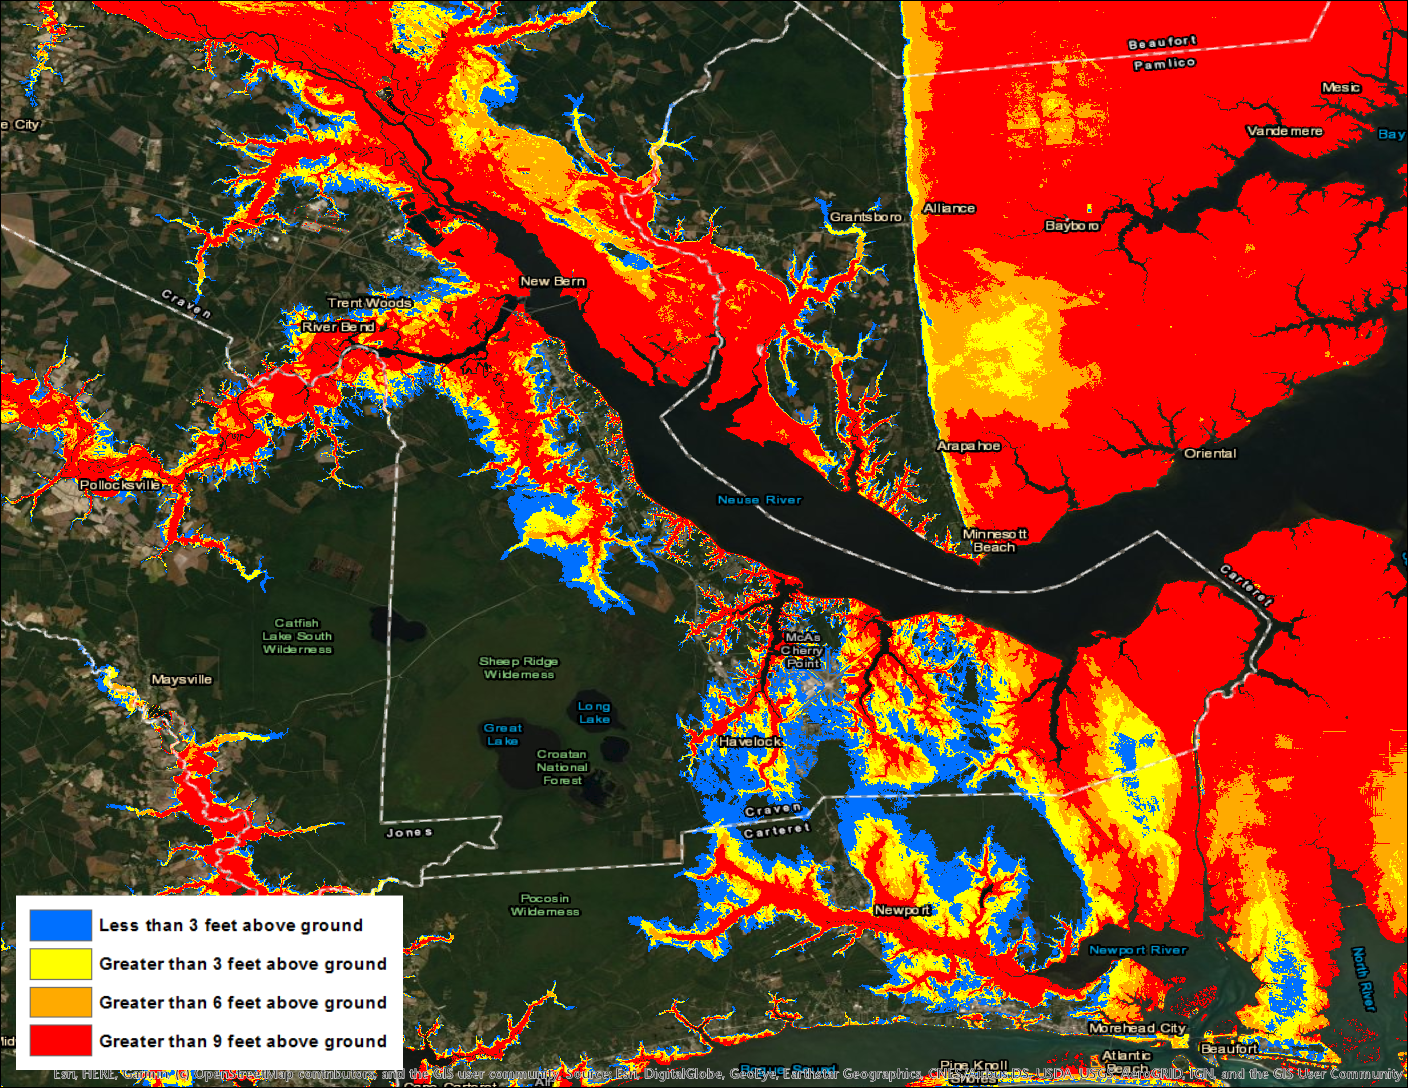
Figure 7. Comparison of MOM (left) and composite MEOW (right) from Figures 4 and 6 above, zoomed in on the New Bern, North Carolina, area.
Remember that at this point in the forecast process, we are looking at synthetic or simulated storms to get an idea of what the near-worst case storm surge inundation could be within an environment characterized by forecast uncertainty that’s very high. What differences do you notice when you compare the two pictures above? Don’t worry–you’re eyes aren’t deceiving you. You probably don’t notice much difference at all. That’s because, unfortunately, slow-moving storms moving in a generally northwestward direction are likely some of the worst types of storms for the New Bern area. Essentially, they’re the storms that are most likely to be causing the storm surge heights you see in the MOM. Our confidence in the hurricane’s forecast has increased since we’re 2 days closer to landfall, but the storm surge risk really hasn’t gone down at all. While that might be a sobering thought, this process allows emergency managers to be as efficient as possible, appropriately assess their risk, and focus on the most at-risk areas. This is a powerful and informative process when used properly!
In the end, while all of eastern North Carolina did not experience the type of storm surge flooding shown in Figure 6 above (which we didn’t expect anyway), some areas did. Areas around New Bern, for instance, had as much as 9 feet of storm surge inundation above ground level (red areas in Figure 8 below). Even though Florence’s peak winds decreased while the storm moved closer to the coast, the MOM and MEOW risk maps accounted for Florence’s increasing size and slow movement (which both contribute to more storm surge) and appropriately prepared emergency managers in the area for a severe storm surge event days before Florence even reached the coast.
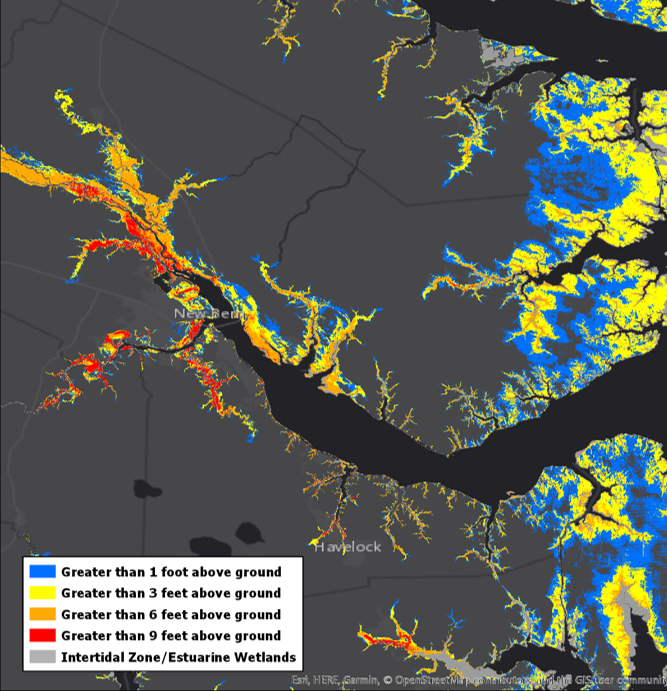
Figure 8. Post-storm model simulation of storm surge inundation caused by Hurricane Florence around the New Bern/Neuse River area of North Carolina.
It’s important to note at this point that MOMs and MEOWs are predominantly used during the period before storm surge or wind-related watches and warnings are in effect for the coast (more than 48 hours before wind or surge is expected to begin). Once we get to within 48 hours when watches or warnings go into effect, another suite of storm surge products–specifically the Potential Storm Surge Flooding Map and the Storm Surge Watch/Warning graphics–become available. These products refine the storm surge risk profile even further because they are based on the characteristics of the actual storm, not on the simulated storms used in MOMs and MEOWs. We plan to create another blog post addressing these products in the near future.
To really bring this home, let’s circle all the way back around to the initial discussion of risk. How does risk tolerance and risk perception affect how these products are used? We know that these products are used by a wide range of people and organizations, all of which have varying tolerances of risk. It is unrealistic to assume that we at the National Hurricane Center could know how these tolerances change across our entire user base. That being said, it is our job to gently guide the decision-making in accordance with our own risk tolerance. Said another way, we work with emergency managers and the Hurricane Liaison Team (HLT) to hopefully bring those risk perceptions more in line with the ACTUAL risk for a given storm. Emergency managers have the resources at their disposal to view MOMs and MEOWs to build out their assessment of risk tailored to their local areas. They possess the intricate knowledge specific to their area which makes them invaluable partners to us at the NHC. During a storm, we sometimes provide advice on types of MOMs and MEOWs to consult to ensure that our partners fully capture a reasonable envelope of risk. These decisions can be stressful, especially when they have to be made in line with a risk tolerance that needs to be low by necessity. Remember what the cost is again here: human lives. It’s imperative that we capture the full breadth of the risk during every storm because the cost of not doing so is immense. We are comfortable accepting that our low risk tolerance can result in some areas not experiencing the potential storm surge that was conveyed prior to a hurricane making landfall. That is, by definition, what having a low tolerance for risk means, but it’s also by design. To us, one life lost is one life too many.
— Taylor Trogdon and Robbie Berg
Reference:
Rappaport, E.N., 2014: Fatalities in the United States from Atlantic Tropical Cyclones: New Data and Interpretation. Bull. Amer. Meteor. Soc., 95, 341–346, https://doi.org/10.1175/BAMS-D-12-00074.1
Share this:

It’s Just a Matter of Time

The hurrier I go, the behinder I get.
— White Rabbit, Alice in Wonderland (Lewis Carroll)
How did it get so late so soon?
— Dr. Seuss
Pressed for Time
Have you ever procrastinated on something for so long that the stress you feel from hurrying at the last minute makes you feel like you’re more and more behind? We have to factor time into a lot of decisions we make in life, but like the White Rabbit and Dr. Seuss, we often feel as though we didn’t leave ourselves enough time to get everything done before a deadline.
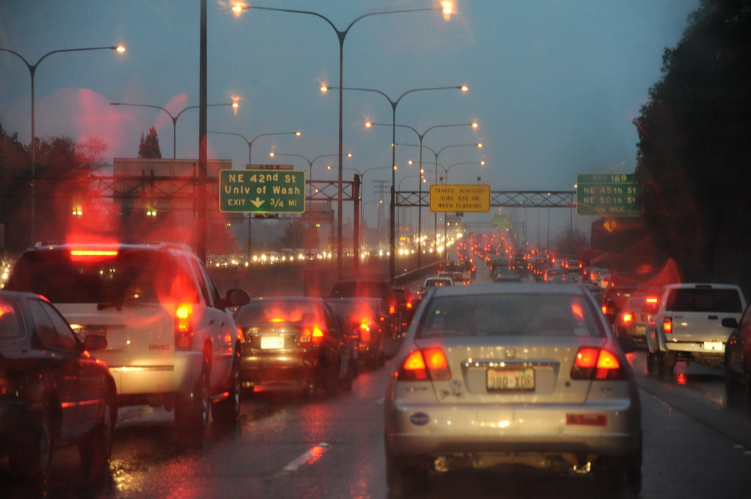
Imagine this scenario: you wake up at 7 AM on a Monday morning, and you have a critically important meeting you MUST attend at the office at 9 AM. If you miss the meeting, it could hurt your career opportunities. You open your window blinds, and you see it’s raining cats and dogs outside. On a good day, it takes you 30 minutes to drive from home to work. “Shoot,” you think to yourself. “I probably should leave a little early to give myself enough time in case traffic is bad.” You hurriedly shower, get dressed, eat some breakfast, and arrange for your significant other to get the kids to school on time. Rushing out the door with your coffee at around 8:15 AM, you pull up your favorite navigation app on your smartphone, select your office as your destination, and dread consumes you. Estimated arrival: 9:15 AM. The rain has caused so many accidents and traffic jams on your route to work that it’s going to take at least an hour to get there. There’s no way you’re going to make it there before the meeting starts.
Now imagine another scenario: you wake up at 8 AM on a beautiful Saturday morning, and you and your family decide that you’re going to spend the day at the beach. In no real rush, you get up, eat some breakfast, pack some food and drinks, and gather your towels, chairs, and beach umbrella. The kids are in even less of a hurry, but you finally get them all in the car. It normally takes you 30 minutes to drive from home to the beach, although you figure that the nice weather will probably mean a lot of other people will have the same idea today, and traffic could be a little heavy. You pull up your navigation app on your smartphone, select your favorite beach, and you’re suddenly a bit annoyed. It’s going to take almost 45 minutes to get there. “Oh well,” you think. “We’re in no particular hurry, and the beach will still be there when we get there.” Forty-five minutes later, you’ve arrived at the beach, you plop yourself on the sand, and time melts away.
As you can imagine, you’d probably approach these two scenarios very differently, and you’d probably have vastly different emotional reactions to the things that make travel time uncertain. The question is how risky are you willing to be while planning when to leave. How bad will it be if you don’t get to your destination at the time you want to get there? Fortunately, navigation programs and apps allow us to account for time uncertainty depending on our tolerance for risk.
Let’s say I will be driving from Miami to Orlando, and my goal is to arrive at 3 PM. When I get directions from my navigation app, the program allows me to select an “Arrive by” time, telling me it will take between 3 hours 10 minutes and 4 hours to get there by 3 PM. The program is trying to account for the typical drive time and the uncertainties (like traffic or road construction) that could make that time longer. So now I have to decide how much risk I want to take on. If I have a high risk tolerance (it’s not the end of the world if I don’t arrive exactly by 3 PM), then I’ll probably decide to go with the low end of the time range (3 hours 10 minutes) and leave at 11:50 AM. If, on the other hand, I have a low tolerance of risk and must be in Orlando by 3 PM, then I’ll probably give myself the full 4 hours and leave Miami at 11 AM. If traffic on Florida’s Turnpike turns out to be light (ha!) and I get there early, no harm, no foul. I’ve avoided undue stress and may have even left myself some time to grab a coffee before my 3 PM appointment.

When Will the Winds Start?
Things aren’t much different when it comes to the arrival or onset of winds associated with a hurricane or tropical storm. When we make a forecast for a hurricane’s future track and size, we can derive a time at which tropical-storm-force winds would begin in a city, based on that specific forecast. We call that a deterministic approach because it in no way accounts for uncertainty in the hurricane’s future track or size. (We attacked the issue of deterministic forecasts in a previous blog post about storm surge forecasting). It’s like assuming we won’t hit any extra traffic that will slow us down when driving from Point A to Point B. But what if the storm moves faster than we’re forecasting? Then the winds will arrive in the city sooner. What if the storm gets bigger than we’re forecasting? That, too, will cause the winds to begin in the city earlier than forecast.
During the 2018 hurricane season, we here at the National Hurricane Center in Miami, and fellow forecasters at the Central Pacific Hurricane Center in Honolulu, began producing new products called the “Arrival of Tropical-Storm-Force Winds” graphics for every tropical cyclone within our areas of responsibility. These graphics serve as a sort of “navigation app,” giving you the times that tropical-storm-force winds are most likely to begin at different locations based on the latest official forecast, as well as “earliest reasonable” times that the winds could begin if the storm speeds up or grows in size. The times provided by these graphics can help you decide when your preparations for a storm should be complete according to how much risk you’re willing to take that you won’t have them quite done in time. If you have no tolerance for risk and must be completely prepared before the winds start, then you’d go with the “earliest reasonable” time. If you have some wiggle room and can afford not to have everything done before the winds start, then maybe you’d be OK going with the “most likely” time.
Let’s look at an example from Hurricane Michael from 2018 to show how these graphics can be useful. Here’s the first forecast issued by NHC for Potential Tropical Cyclone Fourteen at 4 PM CDT October 6, when the pre-Michael disturbance was located over the northwestern Caribbean Sea.

This first official forecast showed the center of eventual-Michael reaching the Florida Panhandle around 1 PM CDT on Wednesday. But obviously the outer wind field from the storm would reach the coast before that time—you just can’t deduce when that will occur from this particular graphic. Here’s what each of the “Arrival of Tropical-Storm-Force Winds” graphics showed for that particular forecast:
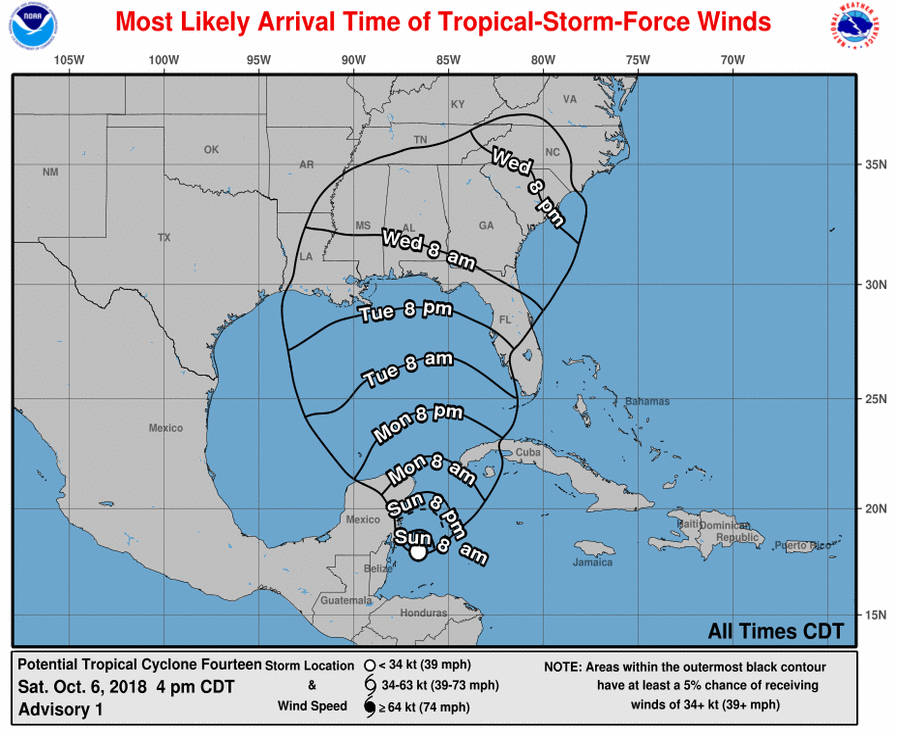

On the left, the Most Likely graphic shows that tropical-storm-force winds were most likely to have begun at locations along the Florida Panhandle between 8 pm Tuesday and 8 am CDT Wednesday, which would have given people about 3 to 3 ½ days to get ready. On the other hand, the Earliest Reasonable graphic on the right shows that tropical-storm-force winds could have begun at locations along the Florida Panhandle coast as early as 8 am CDT Tuesday, lessening the preparation time to about 2 ½ days. (Editor’s note: You’ll note that I’ve used bold red and black coloring of the text in these scenarios to match the bold red and black titles of the two versions of the graphics above). Not only would these times help people decide when to have their preparations done, but they also help emergency managers decide when to call evacuations, based on how much time it would take to get people out of areas vulnerable to storm surge before tropical-storm-force winds begin.
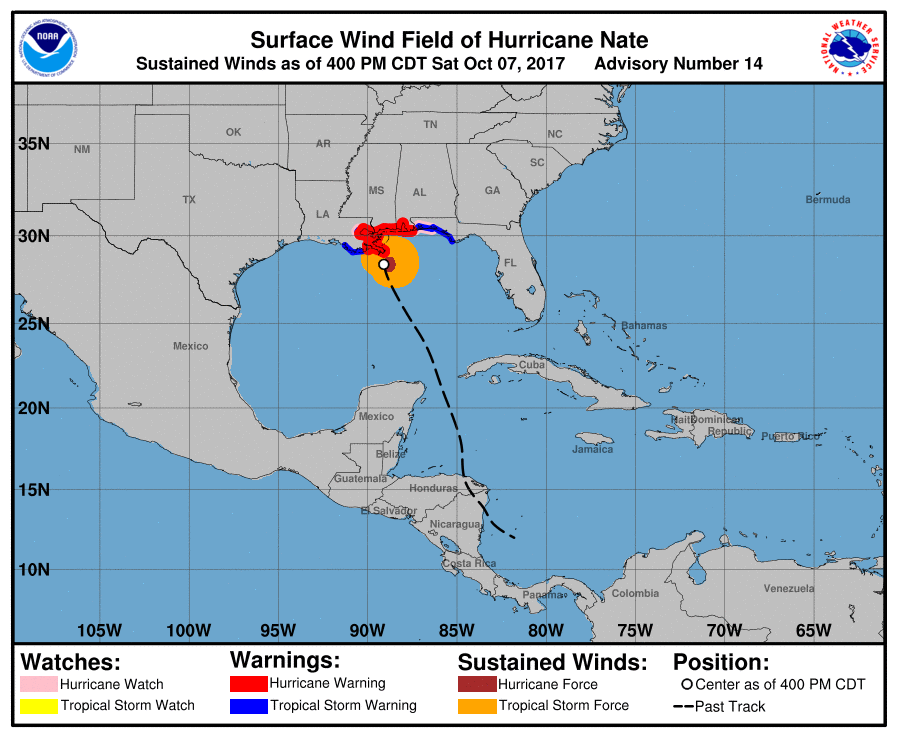
So when did sustained tropical-storm-force winds actually arrive on the coast of the Florida Panhandle? According to the Surface Wind Field graphic, they began roughly around 4 am CDT Wednesday, which falls within the “Most Likely” range discussed above. In the case of Michael, the track forecast turned out to be very good, and the Most Likely Arrival Time product provided an accurate onset time of tropical-storm-force winds.

Not all track forecasts are this accurate, however. Consider Hurricane Nate, which made landfall along the Gulf Coast about a year earlier in 2017. The first official forecast issued by NHC for Tropical Depression Sixteen at 11 am EDT Wednesday, October 4 showed the center of eventual-Nate reaching the Gulf Coast Sunday morning (see below). The corresponding arrival time graphics showed tropical-storm-force winds most likely to begin overnight Saturday, but they could have begun as early as during the day Saturday.


Nate moved faster across the Gulf of Mexico and a little farther west than was originally forecast, and its tropical-storm-force winds first reached the coast during the day on Saturday. For this particular storm, the times indicated on the Earliest Reasonable graphic (right) ended up being closer to the times when tropical-storm-force winds began in southeastern Louisiana.
The problem is that we can never nail arrival times exactly because we can’t know beforehand if a storm will follow the official forecast or deviate in some way that affects when winds will first reach the coast. That’s why it’s probably prudent to consult both versions of the product and consider what types of decisions you must make before a storm arrives. But if you want to be sure that you’ll be prepared before the winds start, it’s advisable to go with the “earliest reasonable” version of the graphic.
There’s one caveat to think about: just because a location is covered by times in the graphics, it doesn’t mean that tropical-storm-force winds will definitely occur at that site. NHC also provides versions of the graphics that show the arrival times overlaid on top of the overall probability of a location receiving sustained tropical-storm-force winds during the next 5 days. So, in reality, the arrival times should be thought of as conditional. They are the possible times that tropical-storm-force winds could begin, assuming that tropical-storm-force winds occur at all. As an example, look at the Most Likely Arrival Time graphic issued for Hurricane Florence, Advisory 50, at 5 pm Atlantic Standard Time (AST), Tuesday, September 11. This graphic shows that locations along the southern coast of North Carolina have a near certainty (>90% chance as indicated by the purple shading) of receiving sustained tropical-storm-force winds, which would most likely begin Thursday morning. Farther north, locations along the coast of Delaware only had a 20-30% chance (as indicated by green shading) of sustained tropical-storm-force winds, but if they happened to occur, they would most likely begin Friday morning.

With that, the time has probably arrived to end this particular blog post. Some may have wanted it to end earlier, which is reasonable, but most likely you are craving more information. In a second blog post, we’ll cover how the arrival times are derived from the official forecast, how the earliest reasonable and most likely times are calculated, and some of the social science research that went into developing the graphics. Stay tuned!
— Robbie Berg
Share this:

Potential Tropical Cyclones – Fitting the “Bill” for More-Timely Warnings

Two years ago this month, Tropical Storm Bill made landfall along the central Texas coast, just 17 hours after becoming a tropical cyclone only 145 miles offshore. The precursor disturbance, a broad and ill-defined area of low pressure, had already been producing tropical-storm-force winds, and there was little doubt that the system would soon bring those dangerous winds onshore. Although NHC’s Tropical Weather Outlooks had been talking about the possibility of those conditions two days in advance, and their likelihood one day in advance, some in the media and emergency management communities lamented the lack of earlier formal tropical storm warnings and full advisory products from NHC. A few even suggested that NHC classify the disturbance as a tropical storm when it wasn’t one. By policy and tradition, NHC advisories, track and intensity forecasts, and any associated watches and warnings begin only after a disturbance has become a tropical cyclone; in this case a tropical storm warning was issued as soon as Bill formed, about 12 hours before the hazardous winds reached the coast. For some additional discussion on why warnings couldn’t have been issued any earlier for Bill, please see our blog post written after that event.
This is hardly the only example of a tropical cyclone striking land shortly after genesis, and well within the normal 48-hour watch/warning time frame. In 2010, Tomas struck Barbados as a tropical storm 27 hours after formation, and St. Vincent and St. Lucia as a hurricane 38 hours after formation. In September of 2007, Humberto made landfall as a hurricane along the Texas coast a mere 19 hours after becoming a tropical cyclone. This recurring problem has been on our minds for a long time, and this season we’ve introduced a service enhancement to address the issue.

Starting this year, NHC has the option to issue advisories, track and intensity forecasts, watches, and warnings for disturbances that are not yet a tropical cyclone, but which pose the threat of bringing tropical storm or hurricane conditions to land areas within 48 hours. This substantial change in policy means that we won’t have to wait for a disturbance to meet the technical requirements of a tropical cyclone (such as having a well-defined center of circulation or sufficiently organized thunderstorm activity) to issue forecasts or post warnings. And boy, it didn’t take long for us to employ this new option, with both the pre-Bret and pre-Cindy disturbances requiring the initiation of potential tropical cyclone advisories on two consecutive days! But more on that in a moment.
 Although we’ve been working on the technical and administrative changes to bring this about over the past two years, the effort actually began after the Deepwater Horizon disaster in 2010, when NHC was asked to provide enhanced forecast support for the response effort. Since then, NHC has been practicing making track and intensity forecasts for disturbances, and at the same time we’ve been improving our ability to forecast tropical cyclone genesis. We now believe that the science has advanced enough to allow the confident prediction of tropical cyclone impacts while these systems are still in the developmental stage.
So for these land-threatening “potential tropical cyclones” (and that’s the term we’re using in our advisories), NHC can now issue the full suite of text, graphical, and watch/warning products that previously has only been used for ongoing tropical cyclones. This includes the cone graphic, public advisory, discussion, wind speed probabilities – everything – and all the products will look exactly the same as our tropical cyclone products. The only thing that’s different is what we call the “system type”; we’ve added POTENTIAL TROPICAL CYCLONE to the roster of possible system types. And since you asked (or at least were thinking about asking), here’s the complete list:
TROPICAL DEPRESSION
TROPICAL STORM
HURRICANE
SUBTROPICAL DEPRESSION
SUBTROPICAL STORM
POST-TROPICAL CYCLONE
REMNANTS OF
POTENTIAL TROPICAL CYCLONE
For those who are interested in the definitions of each of these system types, you can find them in National Weather Service Instruction 10-604, Tropical Cyclone Names and Definitions.
We did consider some alternatives to the term potential tropical cyclone. “Tropical disturbance” was a fairly obvious option but we knew that some of these precursor disturbances weren’t going to be tropical in nature (such as a frontal cyclone evolving into a subtropical or tropical cyclone), so that eliminated tropical disturbance. Another option was simply “disturbance”, which aside from evoking Star Wars imagery (I felt a great disturbance in the Gulf), did not in our view adequately convey the appropriate level of threat. In the end, potential tropical cyclone seemed both accurate and appropriate to the threat, although it’ll take a bit of getting used to for some.
Potential tropical cyclones will share the naming rules currently used for depressions, with depressions and potential tropical cyclones being numbered from a single list (e.g., “One”, “Two”, “Three”, …, “Twenty-Three”, etc.). The assigned number will always match the total number of systems we’ve written advisories on within that basin during the season. For example, if three systems requiring advisories have already occurred within a basin in a given year, the next land-threatening disturbance would be designated “Potential Tropical Cyclone Four”. If a potential tropical cyclone becomes a tropical depression, its numerical designation doesn’t change (i.e., Potential Tropical Cyclone Four becomes Tropical Depression Four).
Potential tropical cyclone advisory packages will be issued at the standard advisory times of 5 AM, 11 AM, 5 PM, and 11 PM EDT, with three-hourly Intermediate Public Advisories being issued at 2 AM, 8 AM, 2 PM, and 8 PM EDT when watches or warnings are in effect. The product suite will include a five-day track and intensity forecast, just as is done for ongoing tropical cyclones. In addition, the Potential Storm Surge Flooding Map and Storm Surge Watch/Warning graphic would be issued for these systems when appropriate. We’ll continue issuing advisory packages on a potential tropical cyclone until watches or warnings are discontinued or until the threat of tropical-storm-force winds for land areas sufficiently diminishes, at which point advisories would be discontinued. However, if it seems likely that new watches or warnings would be necessary within a short period of time (say 6-12 hours), then advisories could continue during that brief gap in warnings in the interest of service continuity.
Since the primary issuance trigger is the threat of tropical storm conditions over land, there won’t be any specific threshold of formation likelihood for the initiation of advisories. For example, a fast-moving tropical wave approaching the Lesser Antilles might already have tropical-storm-force winds but no closed wind circulation. In this case, a genesis forecast of 40% – 50% would likely be enough to trigger advisories and warnings. In contrast, a genesis forecast of 70% for a system close to shore might not trigger advisories if the system were not expected to reach tropical storm strength before moving inland.
The issuance of NHC products for potential tropical cyclones is very much analogous to the change that occurred after Hurricane Sandy in 2012, when NHC advisories on post-tropical cyclones became possible. After Sandy, we realized that there was great benefit to users in NHC’s being able to continue writing advisories on systems even after they were no longer a tropical cyclone. That solved the service continuity problem on the “back end”, and now we’re completing the process by ensuring a steady flow of information on the front end of a tropical cyclone’s life cycle. In all cases, we’ll be trying to ensure that warning types (tropical vs. non-tropical) don’t have to change in the middle of an event.
There are some things to be aware of with this new capability. First, potential tropical cyclone advisories will not be issued for systems that threaten only marine areas – largely because this would pose an unmanageable workload/staffing issue for us but also because marine forecast products (the High Seas and Offshore Waters forecasts) already allow the issuance of gale and storm warnings before a tropical cyclone has formed.
Second, because potential tropical cyclones will have a standard five-day forecast track and uncertainty cone, to avoid potential confusion with the cone we’re going to stop drawing potential formation areas for these systems in the Graphical Tropical Weather Outlook.

We’re also concerned that some users may pay too much attention to the longer-range part of these new forecasts (the part beyond 72 hours). We know that forecast errors for weaker and developing systems tend to be larger than those for strong storms and hurricanes, and we even considered only going out to 72 hours with the new potential tropical cyclone advisories (since the primary purpose was to support watches and warnings). But in the end, consistency and technical issues argued for going out to five days, and that’s what we’re doing. So it’s likely that forecast-to-forecast changes in the longer-range portion of our potential tropical cyclone advisories will be larger than what folks are used to. And for those of you who like to look at forecast model intensity guidance, be aware that most of these intensity models assume the system is a tropical cyclone. Since that won’t be the case for these systems, intensity models run on potential tropical cyclones will generally have a high bias. And lastly, since many potential tropical cyclones will not have well-defined centers, there will likely be large jumps in the reported location of these systems from advisory to advisory. But even with all these caveats, we think that the ability to post warnings before a cyclone forms is an important service enhancement – one that will help save lives and protect property, while at the same time allowing NHC to analyze and report on tropical systems as accurately and as honestly as possible.
After our experiences with Bret and Cindy, we’re optimistic about the value of this new capability. Advisories on Potential Tropical Cyclone Two were started 24 hours before Bret officially became a tropical cyclone, giving residents of Trinidad and Tobago, Grenada, and northeastern Venezuela an additional day of warning for tropical storm conditions. If this were still 2016, places like Trinidad may have only had three to six hours between the time of the first advisory and the time when tropical storm force winds began on the island. And for Cindy, advisories on Potential Tropical Cyclone Three were initiated roughly 21 hours before Cindy met the criteria of a tropical cyclone. This allowed Tropical Storm Warnings to be issued for southeastern Louisiana 21 hours earlier than they would have been if the storm had occurred last year.


Just a few weeks into the new season, we’re pretty happy about the way this all worked. We think we successfully demonstrated the ability to provide more advanced warning than we could have in previous years for these developing tropical cyclones. But we’d love to hear feedback from our users, customers, and partners. Were the potential tropical cyclone advisories in advance of Bret and Cindy confusing? Helpful? Maybe both? Or bad puns aside, did the new capability fit the “Bill”?
If you’d like to provide comments on your experiences with the Potential Tropical Cyclone advisories during Bret and Cindy, please feel free to contact Jessica Schauer, the NWS Tropical Cyclone Program Leader, at Jessica.Schauer@noaa.gov.
— James Franklin
Editor’s Note: This post marks James’s last blog contribution as a member of the NHC family. After 35 years of service in the federal government (17 years at NOAA’s Hurricane Research Division and 18 years at the National Hurricane Center), James is retiring at the end of this week. We want to thank James for his contributions to not only the blog, but also for his many contributions to hurricane forecasting and NHC operations over the past several decades. Although James will no longer be “inside the eye” of the sometimes-hectic NHC scene, we know he won’t be too far away cheering on his beloved Miami Hurricanes, Miami Dolphins, and Florida Panthers. Congratulations, James, and happy retirement!
Share this:

Complete Your Written Hurricane Plan
Get a Plan!
Bryan Koon
Director, Florida Division of Emergency Management
@BKoonFDEM / @FLSERT


A lot of the advice you hear in advance of hurricane season includes some variation on “Get a Plan”. And you may have thought, “Why? How difficult can it be?” The truth is, it’s really not difficult. Most of the things that I want you to consider when dealing with a natural disaster such as a hurricane are basic, common-sense issues that you deal with every day of your life. The problem is that when a hurricane or other severe weather is bearing down on you and your family, the things that you normally take for granted may be in short supply, and you’ve got to get a lot done in a very short period of time. In those circumstances, having gone through the planning process with your loved ones, and developing a written plan to help guide your actions, could save your life.
 Simply considering developing a plan is a very good first step. It will help you think about the hazards where you live. Are you close to the ocean and potentially in a storm surge zone? Do you live in a flood plain? Do you live in a house likely to be damaged in high winds? Are the roads you rely on to get to the grocery store or the pharmacy prone to flooding? Knowing how a storm can affect you will help determine what kind of plan you should develop.
Once you know how a hurricane will affect your physical environment, consider what that means for your loved ones. Do you care for young children or elderly relatives? Do you have pets or livestock that you need to care for? Think about how a prolonged period without power or water will affect them. What would you do if you couldn’t get to the grocery store for a few days, or if the gas station ran out of fuel?
Once you’ve thought about these issues, though, take the next step and write down your answers. When a hurricane is coming, having a written plan will help ensure that you’re taking care of the most important things. And by going through the planning process together, you and your family will be more confident that you’ll be able to survive the storm and get your life back to normal as quickly as possible. Having a guide to make sure you’ve taken care of the essentials will give you peace of mind and allow you to focus on keeping your family safe.
Will everything go exactly as you planned it? Probably not. There are so many variables in a hurricane and so many unknown factors that you’ll likely have to improvise. But it’s much easier to deviate from a well-considered plan than it is to try to develop a course of action from scratch during the middle of the event.
There are a lot of resources to help you. In Florida, try www.flgetaplan.com. In South Carolina go to http://www.scemd.org/planandprepare/preparedness/famdiasterplan, and in Texas a good resource is http://www.texasprepares.org/. Other great sites include The Red Cross and FEMA’s Ready.gov site. And there are many more; simply search “disaster plan” on the internet and you’ll find plenty of options. All of them are very good, and any one of them will help you accomplish your goal of getting you ready. Kids can even get involved by helping their parents fill out a family communication plan.

Hurricanes are a fact of life, and their impacts can be catastrophic. If you are well prepared for them however, the likelihood that you will survive and be able to recover quickly are tremendously improved. That preparation starts with developing a plan to guide you through the situation. An hour or two spent now on writing your plan could save your life!
Share this:

Identify Your Trusted Sources of Information
Identifying Trusted Sources for a Hurricane Event
Dr. Gina Eosco
Senior Social Scientist/Risk Communication Specialist, Eastern Research Group
@WxComm / @ERGupdate

![]()
Hurricanes are dangerous! Extreme winds, storm surge, inland flooding from heavy rains, and tornadoes can all be life threatening. Understanding your risk from these threats is important—and a trusted, credible source for hurricane information can help.
 When a storm is threatening your area, there are many places to go for information to determine if you are at risk….
- The National Weather Service, including the National Hurricane Center
- TV stations
- Websites
- Social media
- And others… like friends and family
But, are all sources of weather information the same? Are all sources trustworthy?
To answer that question, you first have to define what is meant by “trustworthy.” As it turns out, several factors contribute to people’s perceptions of trust, including the source’s knowledge and expertise, openness and honesty, and concern and care.[i] Using these factors of trust, here are some tips to identify trusted sources of hurricane information:
Does your source have hurricane knowledge and expertise? Knowledge and expertise are gained through a combination of study and practical experience. Does your source hire staff with degrees in meteorology? In addition to formal degrees, the American Meteorological Society certifies individuals who have “achieved a high level of competency in communicating complex weather.” The National Weather Association also offers a certification program. These certifications and corresponding logos are shown on TV next to a broadcaster’s name, online, or in someone’s biography.
Of equal importance is how many years of experience does your source have? Hurricanes are like fingerprints. No two storms are the same. Forecasters must observe, collect, and analyze complex data to determine the hurricane track, intensity, and potential impacts, like storm surge. It stands to reason that the more experience a source has with different storms, the more knowledge and expertise that individual has gained over time.
Determining if a source is open and honest is a bit more subjective. Here are a few guiding thoughts.
 Does your source convey what he or she knows and doesn’t know? There is always some uncertainty with a storm. Communicating uncertainty is vital to an open dialogue about the risk of hurricanes. For example, during Hurricane Joaquin in September and October of 2015, the National Hurricane Center issued a new “key messages” section in their Tropical Cyclone Discussion and also sent it out on Twitter, at one point stating, “Because landfall, if it occurs, is still more than three days away, it’s too early to talk about specific wind, rain or surge impacts from Joaquin in the United States.” NHC openly shared what it did and did not know about the storm.
The last factor that leads to trust is perceiving that a source has concern and care for you. You might get the impression that a source feels concern and care by his or her tone of voice or word choice—but how do you really know? One way to gauge concern and care is by understanding the source’s mission. For instance, the National Hurricane Center explicitly states that its mission is
“To save lives, mitigate property loss, and improve economic efficiency by issuing the best watches, warnings, forecasts and analyses of hazardous tropical weather, and by increasing understanding of these hazards.”
Hurricanes can be fearful experiences to live through, and evacuation decisions can be equally as stressful. Hurricane risk information from a trusted source can calm those fears and provide the details you need to make an informed decision that is right for you.
Hurricanes may vary in their strength, but with trusted sources by your side, you can always remain #HurricaneStrong.
Reference:
[i] Peters, R. G., Covello, V. T., & McCallum, D. B. (1997). The determinants of trust and credibility in environmental risk communication: An empirical study. Risk analysis, 17(1), 43-54.

