Why Tropical Cyclone Size Matters: A Comparison of Hurricanes Charley (2004) & Ian (2022)
Peyton Collado, Former Student Intern, and John Cangialosi, Senior Hurricane Specialist
A Tale of Two Storms
In 2004 and 2022, southwest Florida was hit by devastating category 4 hurricanes. The eyes of Charley and Ian made landfall within a few miles of one another, with sustained winds up to 150 mph in both hurricanes. These hurricanes led to catastrophic damage, but to what extent? With such similarities between Hurricanes Charley and Ian, why was the overall footprint of the impacts and hazards so different?

Naturally, as Ian threatened the Florida coast in late September 2022, it was hard at the time to not look back and compare the potential impacts to Charley. This made sense at first glance since they were both category 4 hurricanes affecting the same part of Florida. However, the potential risks can be deceptive if we only look at those two factors. Even though the track and intensity of the hurricanes were incredibly similar, the estimated damage cost (normalized to 2024) was about 4.5x higher in Ian and the death toll was more than 10x higher as the winds, storm surge, and rainfall from Ian stretched across a much larger portion of Florida. Let’s take a closer look at what led to such differences in the distribution of the impacts.
A Word on Wind Radii
The National Hurricane Center issues forecasts of the track, intensity, and size (wind radii) of tropical storms and hurricanes. Most individuals are more familiar with the track and intensity forecasts seen on many cone graphics, but what about wind radii? Wind radii is a feature on many hurricane hazard graphics that corresponds to how far tropical-storm-force and hurricane-force winds extend away from the storm’s center.
| 34 kt winds (39 mph) | Scattered debris & light projectiles. Fallen power lines that could lead to power outages. Possible damage to roof shingles & siding. |
| 50 kt winds (58 mph) | Damage to roof shingles, siding, & gutters. Downed trees & power lines. Unfastened homes of light weight could become airborne. Widespread power outages. |
| 64 kt winds (74 mph) | Possible wall & roof failure. May blowout windows. |
The chart above briefly touches on wind-related damage associated with tropical-storm-force and category 1 hurricane-force winds. Given the potential impacts from wind alone, when a hurricane poses a threat, it is vital to understand the extent of such winds as impacts can be seen hundreds of miles away from the center track. Furthermore, the extent of winds strongly correlates to other hurricane hazards, like storm surge. While Charley and Ian had their similarities, their size difference played a major role in vast differences in wind and storm surge damage, and resulting loss of life. So how much did their wind radii differ?
In the following figure, we can start to see why Ian and Charley were different. It can be seen that tropical-storm-force winds (yellow) from Ian are much larger than those of Charley. Although both systems had similar peak winds at landfall, the hurricane-force winds (red) in Ian extended out more than 20 nautical miles from Charley’s, which impacted more than double the coastal area than Charley.
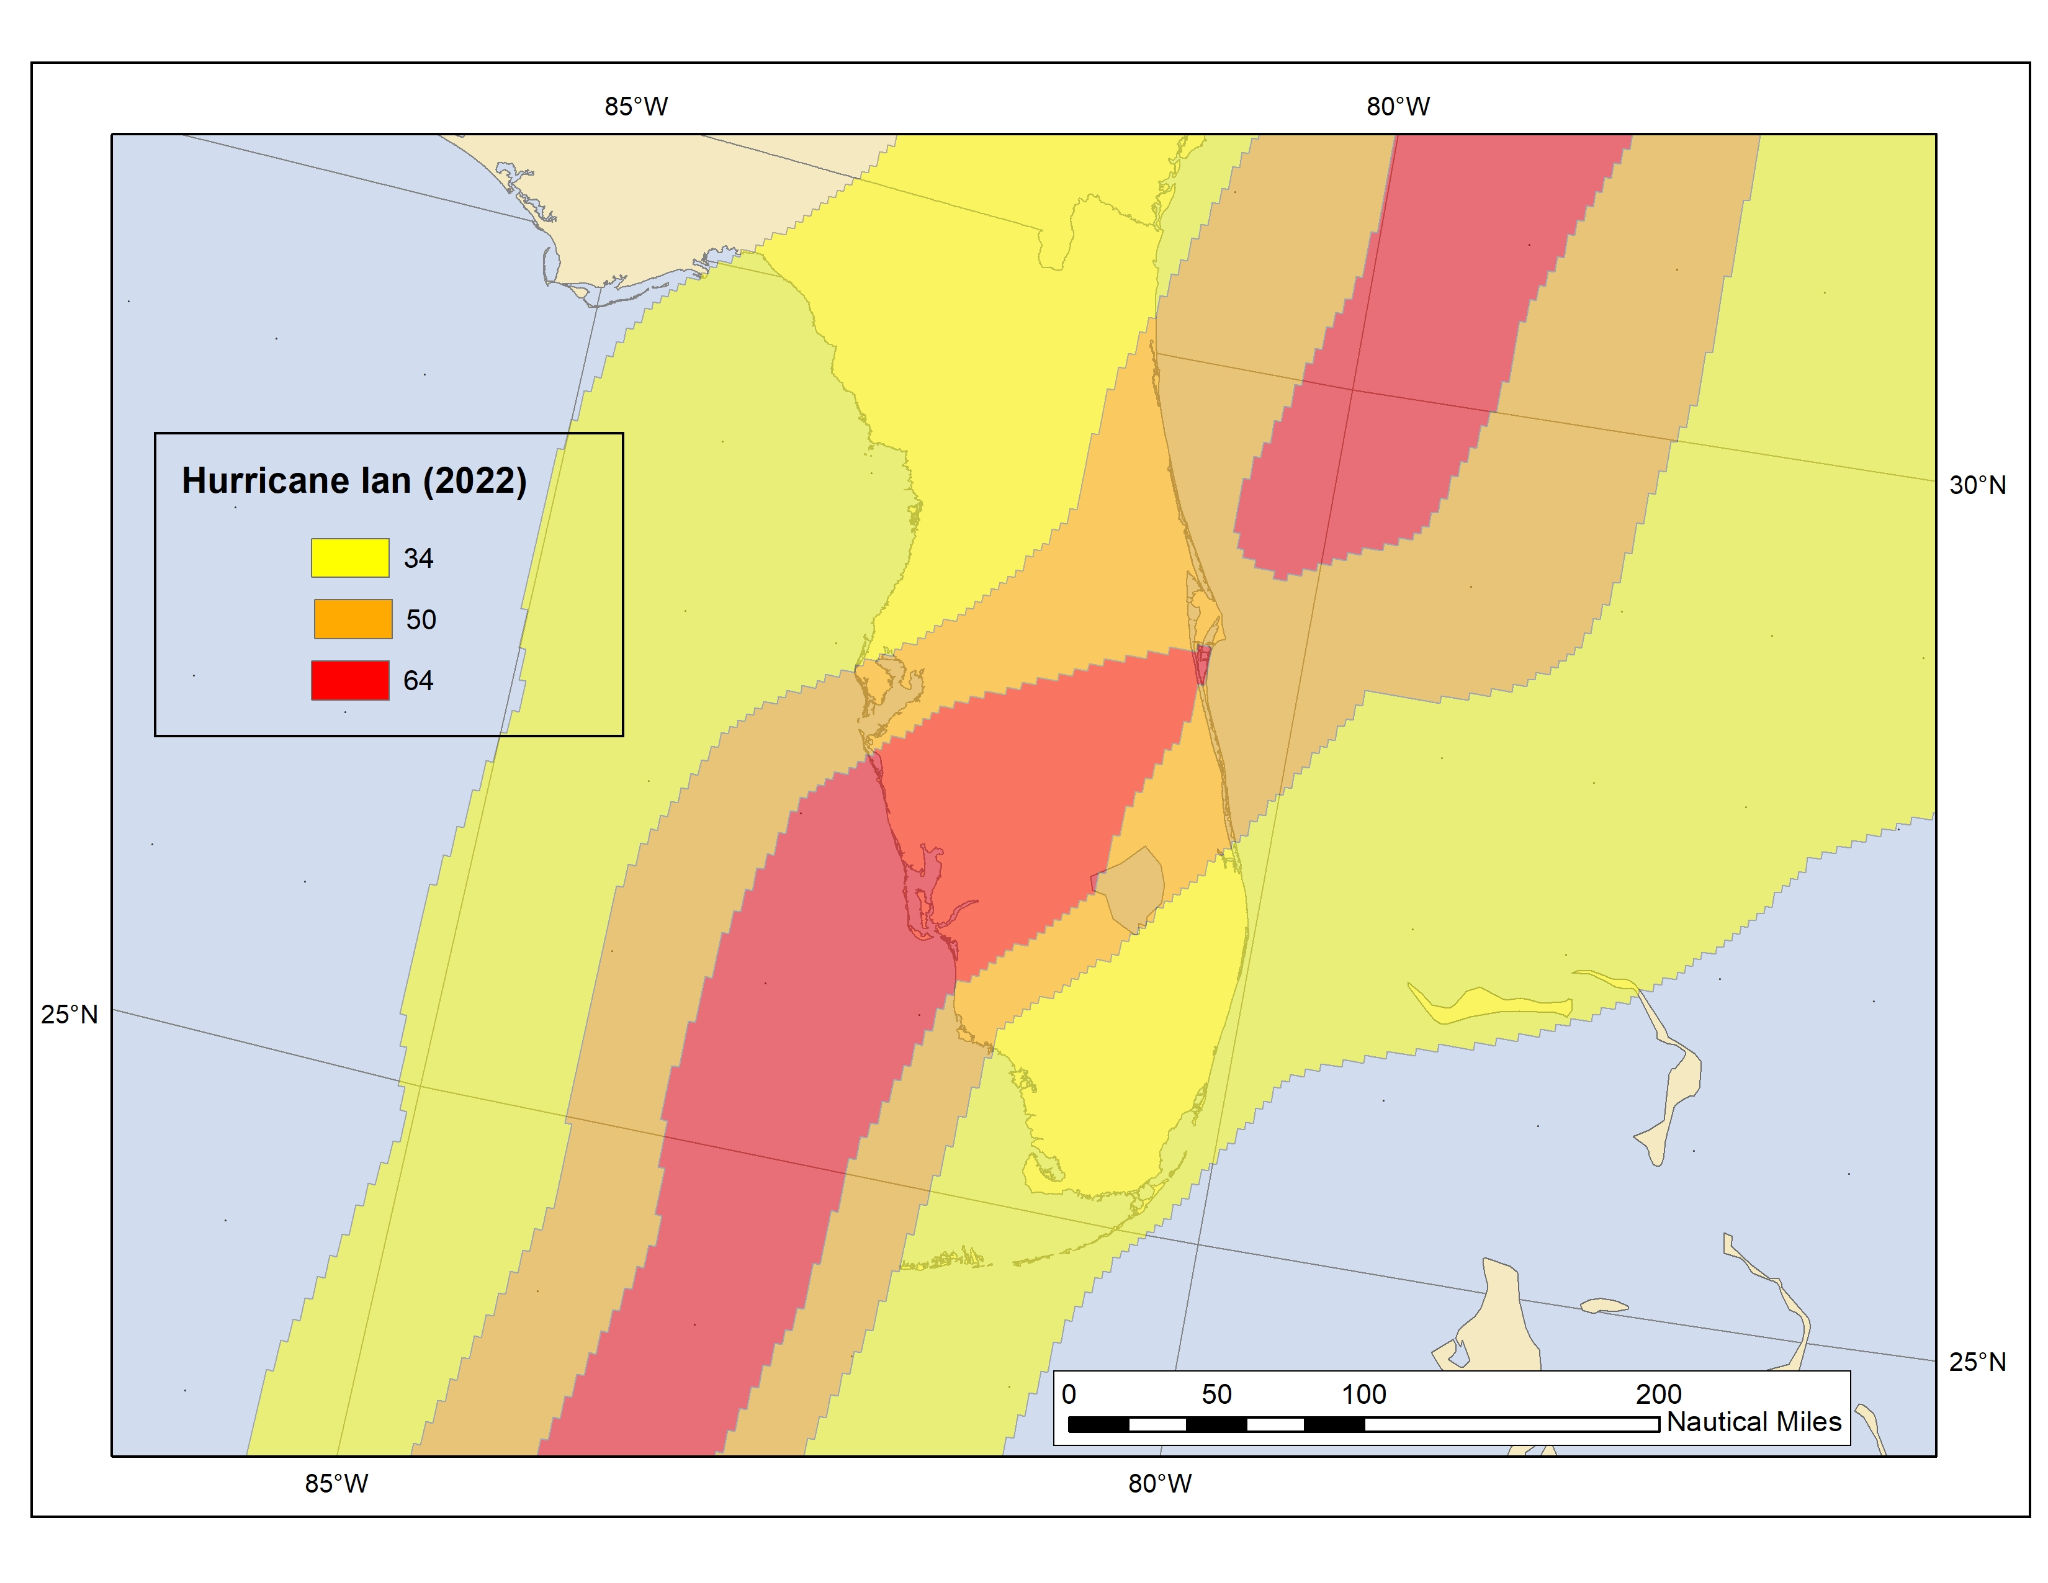

Maximum wind extents of Hurricane Ian (left) and Hurricane Charley (right) (winds in knots)
The larger area of strong winds in Ian is a major factor in why the storm surge was much worse in that hurricane. The strong onshore winds on Ian’s east side pushed ocean water inland over a much larger region of southwest Florida, which was responsible for the majority of the damage and fatalities there. Not only was the storm surge higher, but it swarmed many more miles of Florida coastlines, taking the lives of more than 40 individuals from this hazard alone during Ian. Conversely, the smaller Charley produced significantly lower storm surge. A way to think about storm surge and how it relates to storm size is to imagine yourself in a pool. Consider how much water you can push around if you move your finger at the top of the water in the pool. On the other hand, how much more water could you move around if you use your entire arm? Hopefully this analogy gives you some perspective on how wind radii (storm size) is correlated to the amount of storm surge.
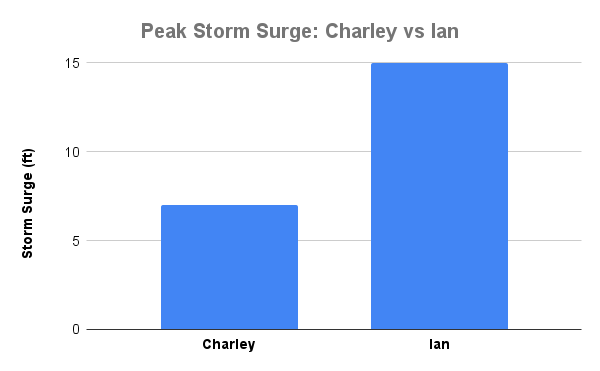
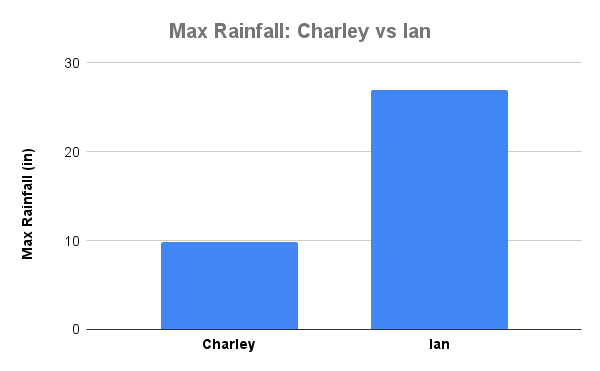
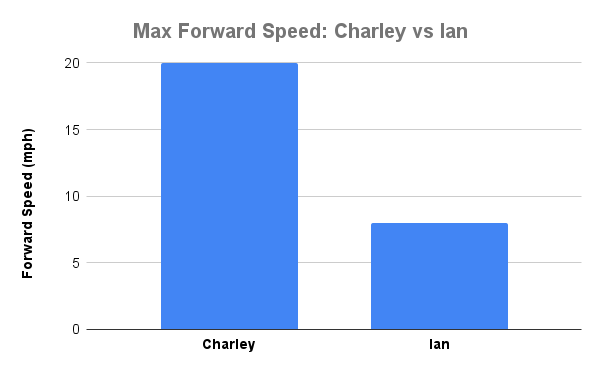
A comparison of the peak storm surge, maximum rainfall amount, and forward speed between Charley (2004) and Ian (2022)
Another costly hazard from Ian was flooding from rainfall. Although the storm size is not perfectly correlated with the total amount of rain from tropical cyclones, they are related. Before Ian made landfall near Port Charlotte Harbor, satellite images captured how large Ian was with rain bands stretching across most of the Florida Peninsula and the Florida Keys. In contrast, Charley’s rain bands were much more compact, generally limited to south and central Florida.
As Ian slowly trekked across the peninsula, about 18 counties were faced with rainfall amounts exceeding 10 inches. With such extensive rainfall, freshwater flooding was a significant threat that lasted well after the storm passed Florida. On the other hand, Charley moved nearly 3x faster than Ian, which in combination with its small size, reduced the total rain footprint, with 5 to 8 inches of rain generally occurring near its track across Florida.


Rainfall amounts from Ian (Left) and Charley (Right). Images courtesy of NOAA’s Weather Prediction Center.
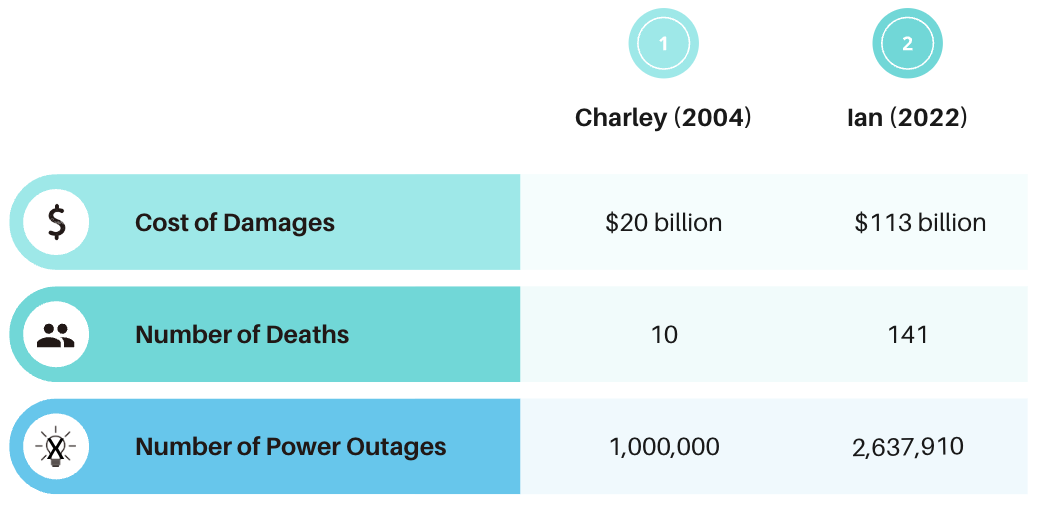
With numerous hazards linked to hurricanes, this comparison highlights why wind radii (storm size) is just as important, if not more important in some cases, as intensity. Below is a table that lists a comparison of United States related damages between Charley and Ian, adjusted for inflation to current U.S. dollars. It is clear to see that size and forward speed are very important factors that are correlated to hazards that affect the extent of damage and fatalities. It should be noted, however, that there has been a significant increase in wealth and infrastructure in southwest Florida between 2004 and 2022 that likely played a role in the notable differences in damage in these events.
Based on climatology, as catastrophic as Ian was, it was relatively close to the average size of a major hurricane near Florida. With the information we have on wind radii today, it is important to compare incoming hurricanes to what a region has previously been faced with. The following bar graph compares the average major hurricane size over Florida, to the sizes of Ian and Charley. With the knowledge of climatology, we can use such guidelines to communicate to the public whether an incoming hurricane is above or below average in terms of size. Based on wind radii data of major hurricanes from 2004-2022, Charley falls in the 10th percentile, and Ian near the 60th percentile. This further emphasizes the importance of paying attention to tropical cyclone size and not just comparing track and intensity of previous hurricanes.

The National Hurricane Center and National Weather Service take into account storm size when issuing watches and warnings, so it is highly advised that individuals use those when making decisions about protecting themselves, their families, and properties. In addition, there are products on the National Hurricane Center’s website that include storm size information, such as the Wind Speed Probabilities, Storm Surge Probabilities and Potential Storm Surge Flooding Graphic to name a few. The bottom line is that forecasters understand how storm size can affect hazards and it is good practice to pay attention to forecasts rather than comparing the current event with previous storms or experiences.

